Research
Findings #15: HMO Enrollment in the United States: Estimates Based
on Household Reports, 1996
by Jessica S. Banthin, Ph.D., and Amy K. Taylor,
Ph.D., Agency for Healthcare Research and Quality
Abstract
This report from the 1996 Medical Expenditure Panel Survey (MEPS)
presents estimates of the total number of people enrolled in HMO (health
maintenance organization) plans for the first half of 1996. The
estimates are based on MEPS household survey data, which rely on
household members' understanding and reporting of HMO status. According
to MEPS household data, 91.6 million people41.9 percent of the total
insured populationwere enrolled in HMOs in the first half of 1996. HMO
enrollment rates were higher among the privately insured than the
publicly insured, higher among children and younger adults than older
adults, and higher for Hispanics and blacks than for the group of whites
and people of other races. In addition, middle- and high-income people
were more likely than those with lower incomes to be enrolled in HMOs.
HMO enrollment was higher in the West and in urban areas. There were
some health status differences in HMO enrollment for publicly insured
people. Among people on Medicare or Medicaid, those who needed help with
daily activities or were limited in their ability to work or do
housework were less likely than others to be in an HMO.
Introduction
The number of people enrolled in managed care
plans has grown rapidly in the last decade. As health care costs
continue to rise, employers increasingly have switched from traditional
indemnity plans to managed care plans in the hope of controlling
the costs of offering health insurance coverage to their employees.
While managed care can take many forms, one of the oldest types
of managed care plans is the health maintenance organization (HMO).
In more recent years, public payers such as Medicare and State
Medicaid programs also have begun to contract with HMOs. An HMO
is a prepaid health plan in which the cost of medical care typically
is covered in full or with a small copayment.
This report presents estimates of the total
number of people enrolled in HMO plans for the first half of 1996.
The estimates are based on data from Round 1 of the 1996 Medical
Expenditure Panel Survey (MEPS) Household Component, which is nationally
representative of the U.S. civilian noninstitutionalized population.
Because household survey data are used, the accuracy of the HMO
enrollment estimates presented in this analysis depend on household
members' understanding and reporting of HMO status. From a consumer's
point of view, the main characteristics of HMOs and other types
of managed care plans, compared with traditional indemnity plans,
are the limited choice of health care providers and smaller out-of-pocket
payments. The Technical Appendix at
the end of this report shows the exact questions used to identify
HMO enrollees in the MEPS Household Component.
This report focuses on HMO enrollment, excluding
from the analyses enrollment in other types of managed care plans.
HMOs are one of the oldest types of managed care health plans,
first becoming common as a result of the 1973 Health Maintenance
Organization Act. This Federal law defined HMO plans, emphasizing
their coverage of preventive care services. The law also mandated
that employers offer an HMO as an insurance choice to their employees
if there is an HMO in the area and if the employer offers a choice
of plans. HMOs are federally qualified if they meet the requirements
spelled out in the 1973 HMO Act and in subsequent modifications.
Whereas older HMOs tend to be nonprofit staff and group models,
many current HMOs include for-profit plans that contract with a
network of individual providers as well as groups.
Some of the estimates
of total HMO enrollees presented in the discussion below cannot
be derived exactly from
the accompanying tables because of rounding error. Whenever the
number presented in the text is at slight variance with the number
generated from the corresponding table, it will be noted.
^top
Total HMO Enrollment
In the first half of 1996, a total of 91.6
million people were enrolled in HMOs. Multiplying the numbers in Table
1 (the percent enrolled in an HMO times the total population)
yields an estimate slightly higher than 91.6 million because of
rounding error. HMO enrollees made up 34.8 percent of the total
U.S. civilian noninstitutionalized population and 41.9 percent
of the population with health insurance (Table
1). The rate of HMO enrollment was significantly higher in
the non-elderly population than in the elderly population (45.6
vs. 20.1 percent). HMO enrollment was also higher among Hispanics
of any race (51.6 percent) and blacks (47.2 percent) than for the
group of whites and others (40.1 percent). (People of other races,
including Asians, Pacific Islanders, American Indians, and Alaska
Natives, are grouped with whites for this report.) In addition,
insured people living in middle- and high-income families were
more likely to be enrolled in an HMO (43.4 percent and 45.6 percent,
respectively) than were people living in poor or near-poor (32.7
percent) and low-income families (37.0 percent). See the Technical
Appendix for definitions of the terms used in this report.
HMO enrollment varied significantly when the
total insured population was broken out into three mutually exclusive
subgroups: people under 65 with any private insurance, publicly
insured people under 65 with no private coverage, and people age
65 and over with Medicare coverage.
HMO enrollment was highest in the privately
insured non-elderly population (Tables
2–4). About 47.6 percent of the privately insured population
under 65, or 75.8 million people, were HMO enrollees. The 1987
National Medical Expenditure Survey showed 28.0 million HMO enrollees
(17.1 percent) in the privately insured population under 65 (Taylor,
Beauregard, and Vistnes, 1995). According to data from these two
national surveys, HMO enrollment grew by a factor of 2.8 from 1987
to 1996.
The rate of HMO enrollment was lower among
the publicly insured non-elderly population than among the privately
insured non-elderly population. In the first half of 1996, 36.5
percent of the publicly insured population under 65, or 9.5 million
people, were HMO enrollees (Table 3).
This total number is at variance with the estimate generated from
the first row of Table 3 because
of rounding error.
The lowest enrollment rates were found among
Medicare beneficiaries age 65 and over. In this group, 20.0 percent,
or 6.2 million people, were enrolled in an HMO in the first half
of 1996, either through their Medicare coverage or through private
insurance (Table 4).
^top
Privately Insured Non-Elderly
Table 2 shows
the percent of the privately insured population under age 65 who
were enrolled in HMOs in 1996 by various characteristics. HMO enrollment
varied by demographic and health-related characteristics, including
age, race/ethnicity, and place of residence.
The rate of enrollment
for all children under age 18 was not significantly different
from that of all adults
under age 65. However, privately insured people ages 55–64
were considerably less likely than those under 55 to be enrolled
in an HMO. Only 36.9 percent of this older age group were enrolled
in HMOs, compared to 46.2–51.7 percent of the younger age
groups.
There were no significant differences in HMO
enrollment by sex for all ages combined, but Table
2 shows some sex differences in HMO enrollment rates for age-sex
groups. Women of childbearing age (19–44 years) were more
likely than men that age to be enrolled in an HMO (51.0 percent
vs. 47.0 percent).
Among the non-elderly privately insured population,
a higher percentage of blacks and Hispanics than people in the
white and other group were HMO members. Only 45.1 percent of privately
insured whites and others were enrolled in an HMO, compared to
57.6 percent of blacks and 62.0 percent of Hispanics.
While HMO enrollment did not differ significantly
by marital status, education level, or insurance status, it varied
by poverty status. Nearly half (48.6 percent) of high-income people
under age 65 were enrolled in HMOs, compared to 41.8 percent of
people this age in poor or near-poor families.
Region of the country and degree of urbanization
were associated with differences in the likelihood of HMO enrollment.
Among privately insured Americans under age 65, people living in
the Midwest were less likely than others to be enrolled in an HMO
(37.8 percent) and people living in the West were more likely to
be an HMO enrollee (59.9 percent). Those living in metropolitan
statistical areas (MSAs) were much more likely to be HMO enrollees
(51.6 percent) than those living outside of MSAs (29.3 percent).
Table
2 also
shows that there were no significant differences in HMO enrollment
among the non-elderly privately insured population by several health
status measures. This finding is important, since many have speculated
that HMOs are able to control costs by enrolling healthier people
than those remaining in traditional indemnity plans. This finding
that there is no difference in HMO enrollment by several health
status measures supports other recent evidence of the lack of selection
in HMO enrollment among the privately insured population under
age 65 (Reschovsky, 1999/2000; Taylor, Beauregard, and Vistnes,
1995). ^top
Publicly Insured Non-Elderly
Table 3 presents
enrollment in HMOs among the non-elderly population covered by
public insurance only. It includes people enrolled in an HMO through
Medicaid, Medicare, or other public programs that provide hospital
and medical coverage but not people covered by CHAMPUS (Armed-Forces-related
coverage). The table also shows data separately for those enrolled
through Medicaid. Among publicly insured Americans, a higher percent
of children (40.0 percent) than adults ages 19–64 (30.1 percent)
were enrolled in an HMO through Medicaid. Breaking this down further,
adults over age 44 were much less likely than younger adults to
be HMO members, while younger adults had an HMO enrollment rate
similar to that of children.
Although there were
no significant differences in HMO membership for publicly insured
non-elderly Americans by
sex, differences can be seen for age-sex groups. Among the publicly
insured population ages 19–44, women were much more likely
than men to be enrolled in any HMO (42.4 percent compared to 28.2
percent).
Race/ethnicity, poverty status, and marital
status did not significantly affect the rates of participation
in HMOs among the publicly insured population. There were, however,
differences by education level and type of public coverage. People
who had not graduated from high school were less likely to be enrolled
in an HMO than those with a high school education (28.0 percent
vs. 37.9 percent). In terms of insurance status, people with Medicaid
only were much more likely to be enrolled in an HMO (39.0 percent)
than either those with Medicare only (11.7 percent) or those with
Medicare plus Medicaid (20.8 percent).
Among non-elderly Americans, regional patterns
in HMO enrollment among the publicly insured were similar to patterns
among the privately insured, with those living in the West more
likely to be HMO members (49.2 percent) than those in the South
(27.3 percent) or the Northeast (34.7 percent). Overall, publicly
insured people living in metropolitan areas were much more likely
than those living elsewhere to be enrolled in an HMO (40.4 percent
vs. 24.0 percent), and this pattern also held for Medicaid recipients
considered separately.
One of the important differences in HMO enrollment
patterns between the privately insured and publicly insured non-elderly
population is in health status. The privately insured population
showed no differences in HMO enrollment by health status, but the
publicly insured non-elderly population showed significant differences
by several health status measures. HMO enrollment was higher for
people in excellent or very good health (40.0 percent) and good
health (38.6 percent) than for people in fair health (26.3 percent)
or poor health (26.9 percent). Similarly, people with excellent
or very good mental health were more likely than people with fair
or poor mental health to be enrolled in an HMO (39.6 percent vs.
26.5 percent). Publicly insured people who did not need assistance
with activities of daily living (ADLs) or instrumental activities
of daily living (IADLs) were more likely to be enrolled in an HMO
than those who did need such assistance ( 37.5 percent vs. 24.7
percent). People who did not have any health limitations that affected
work, housework, or school were more likely than those with limitations
to be enrolled in an HMO ( 38.4 percent vs. 24.8 percent).
^top
Elderly Medicare Enrollees
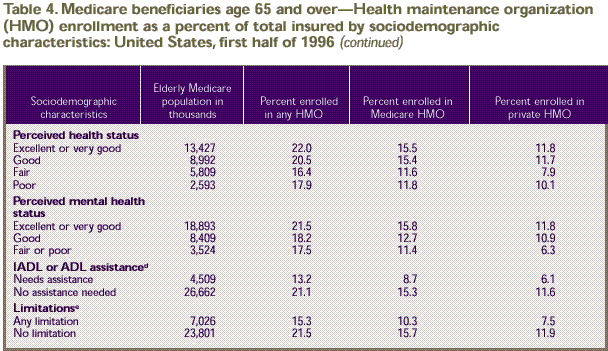
Table 4 presents
estimates of HMO enrollment for the Medicare-insured population
age 65 and over. Elderly people without Medicare coverage are not
included. The table presents separate statistics on HMO enrollment
through private insurance and HMO enrollment through Medicare.
A person can be enrolled in an HMO directly through Medicare as
part of the Medicare + Choice program. Another way a Medicare recipient
can be enrolled in an HMO is through a supplemental insurance policy,
sometimes called a Medigap plan, or through a retirement health
plan offered by a former employer. This is an important distinction
because about 61.5 percent of Medicare beneficiaries held private
coverage in addition to their Medicare coverage in 1996 (Vistnes
and Monheit, 1997). Twenty percent of all elderly noninstitutionalized
Medicare beneficiaries, or 6.2 million people, were enrolled in
an HMO through any source of insurance. About 14.3 percent of all
beneficiaries, or 4.5 million people, were enrolled in an HMO through
Medicare coverage.
HMO enrollment through Medicare and HMO enrollment
through private insurance have slightly different patterns by age
group. While there were no significant differences in Medicare
HMO enrollment by age group, Table 4 shows
that younger beneficiaries were more likely than older beneficiaries
to be enrolled in an HMO through private insurance (13.4 percent
of beneficiaries ages 65–74 vs. 7.4 percent for ages 75–84
and 6.8 percent for age 85 and over). Similarly, beneficiaries
ages 65–74 were more likely than those in older age groups
to be enrolled in an HMO through either source of insurance. There
are no significant differences by sex or age-sex groups.
Almost a third of Hispanics (32.3 percent)
were enrolled in any HMO (Medicare or private insurance enrollment).
This is significantly higher than overall HMO enrollment rates
among blacks (20.6 percent) and the white and other group (19.3
percent).
Low-income, middle-income, and high-income
elderly Medicare beneficiaries were more likely than poor and near-poor
beneficiaries to be enrolled in any HMO. Among poor or near-poor
beneficiaries, 15.5 percent were enrolled in an HMO, compared to
24.4 percent of low-income, 22.6 percent of middle-income, and
21.2 percent of high-income beneficiaries. Limiting the focus to
Medicare HMOs, a similar pattern existed. Only 11.7 percent of
poor and near-poor beneficiaries were enrolled in Medicare HMOs,
compared with 18.3 percent of low-income and 17.3 percent of middle-income
beneficiaries. There were no differences in HMO enrollment rates
by education level or marital status.
In 1996 enrolling in a Medicare HMO often meant
extra benefits, such as prescription drug coverage, which could
save beneficiaries the cost of a supplemental Medigap policy. Thus,
it is not surprising that the highest Medicare HMO enrollment rate
(20.6 percent) was among beneficiaries with Medicare only (no private
or public supplemental insurance). This rate was higher than the
HMO enrollment rates of 10.3 percent for beneficiaries with Medicare
and Medicaid and 12.2 percent for beneficiaries with Medicare and
private insurance.
Regional differences in HMO enrollment for
elderly Medicare beneficiaries followed patterns similar to those
of younger populations. HMO enrollment was most common in the West,
where 40.4 percent of Medicare beneficiaries were enrolled in an
HMO. Similarly, residents of metropolitan areas were more likely
to be enrolled in an HMO than those living in nonurban areas (24.0
vs. 6.8 percent).
Health status differences are of particular
concern for Medicare HMOs because the Health Care Financing Administration
did not adjust payments to HMOs for such differences in 1996. Among
all Medicare beneficiaries age 65 and over, there were no significant
differences in the rates of enrollment in Medicare HMOs by general
perceived health status or by mental health status. However, looking
at enrollment in private HMOs shows that Medicare beneficiaries
in fair health were less likely than those in very good and excellent
health to be enrolled. In addition, both Medicare and private HMO
enrollment rates show significant differences by need for ADL or
IADL assistance and by work or housework limitations. Beneficiaries
who required assistance with ADL or IADL activities were less likely
to be enrolled in an HMO through Medicare (8.7 percent) or through
private insurance (6.1 percent) than those who did not require
such assistance (15.3 and 11.6 percent, respectively). Similarly,
beneficiaries with limitations in the ability to do work or housework
were less likely to enroll in an HMO through Medicare (10.3 percent)
or through private insurance (7.5 percent) than those without such
limitations (15.7 and 11.9 percent, respectively).
^top
Conclusion
HMO enrollment grew
rapidly in the last decade, to the point that 91.6 million people
were enrolled in the first
half of 1996. This figure represents 41.9 percent of the total
insured population for that year. Although HMOs were commonplace
in 1996, there were significant differences in HMO enrollment by
insurance status, age group, race/ethnicity, poverty status, and
geographic area. Enrollment rates were higher among the privately
insured than the publicly insured and higher among children and
younger adults than older adults. Women of childbearing age were
more likely than men of the same age to be enrolled in an HMO.
Hispanics and blacks were more likely than whites and persons of
other races to be enrolled in an HMO. In addition, middle- and
high-income people were more likely than poor, near-poor, or low-income
people to be enrolled in an HMO. Within the publicly insured population,
there were some health status differences in HMO enrollment. Among
the population with Medicaid or Medicare, people who needed assistance
with ADL or IADL activities or who were limited in their ability
to work were less likely than other Medicaid or Medicare enrollees
to be enrolled in an HMO. Across all insurance groups, HMO enrollment
was higher in the West and in urban areas than in other locations. ^top
References
American Association of Health Plans. Managed
care facts. Washington (DC); 1998.
Cohen J. Design
and methods of the Medical Expenditure Panel Survey Household
Component. Rockville (MD): Agency
for Health Care Policy and Research; 1997. MEPS Methodology Report
No. 1. AHCPR Pub. No. 97–0026.
Cohen JW, Monheit
AC, Beauregard KM, et al. The Medical Expenditure Panel Survey:
a national health information
resource. Inquiry 1996;33:373–89.
Cohen S. Sample
design of the 1996 Medical Expenditure Panel Survey Household
Component. Rockville (MD): Agency
for Health Care Policy and Research; 1997. MEPS Methodology Report
No. 2. AHCPR Pub. No. 97–0027.
Eppig F. Personal communication from Franklin
Eppig, Health Care Financing Administration, to Jessica Banthin,
Agency for Healthcare Research and Quality; 1998 Mar 10.
Kerwin, J, Cantor
D, Sheridan S. Results of Rounds 3 and 4 of managed care cognitive
interviews for the household
portion of NMES. Westat Deliverable #1.4.3. March 6, 1995.
The Centers for Medicare and Medicaid Services.
Medicaid information page [cited 1999 Mar 4]. Available from: URL: http://www.cms.hhs.gov/medicaid/default.asp
Interstudy. HMO
industry report 8.2 press release [cited 1998 Nov 12].
Reschovsky JD. Do
HMOs make a difference? Data and methods. Inquiry 1999/2000;36(4):378–89.
Taylor AK, Beauregard
KM, Vistnes JP. Who belongs to HMOs: a comparison of fee-for-service
versus HMO enrollees.
Medical Care Research and Review 1995;22(3):389–408.
Vistnes JP, Monheit
AC. Health insurance status of the civilian noninstitutionalized
population: 1996. Rockville
(MD): Agency for Health Care Policy and Research; 1997. MEPS Research
Findings No. 1. AHCPR Pub. No. 97–0030.
^top
Tables
Table 1. Health maintenance organization (HMO) enrollment as a percent of total insured: United States, first half of 1996
Demographic Characteristics |
Number in thousands |
Percent enrolled in HMOs |
| Total population |
263,516 |
34.8 |
|
Insured population a |
| Total insured population a |
218,760 |
41.9 |
| Age in years |
|
|
| 18 and under |
62,912 |
46.8 |
| 19-64 |
124,279 |
45.0 |
| Total under 65 |
187,191 |
45.6 |
| 65 and over |
31,568 |
20.1 |
| Sex |
|
|
| Female |
114,319 |
42.1 |
| Male |
104,440 |
41.7 |
| Race/ethnicity |
|
|
| Hispanic b |
18,886 |
51.6 |
| Black |
25,407 |
47.2 |
| White and other |
174,466 |
40.1 |
| Poverty Status c |
|
|
| Poor/near poor |
34,762 |
32.7 |
| Low income |
28,570 |
37.0 |
| Middle income |
74,561 |
43.4 |
| High income |
80,867 |
45.6 |
a Includes
all persons covered by private insurance, Medicaid, Medicare,
CHAMPUS /CHAMPVA (Armed-Forces-related coverage), and other public
hospital/physician coverage.
b Includes
Hispanics of all races; the other race/ethnicity categories exclude
Hispanics.
c Limited to persons insured in Round 1 who reported
annual family income. Poor indicates family income is less
than 100 percent of the poverty line, near poor indicates
family income is 100 to less than 125 percent of poverty,
low income
indicates family income is 125 to less than 200 percent of
poverty, middle income indicates family income is 200 to
less than 400 percent of poverty, and high income indicates
family
income is 400 percent or more of poverty.
Source: Center
for Financing, Access, and Cost Trends, Agency for Healthcare
Research and Quality: Medical Expenditure Panel Survey Household
Component, 1996 (Round 1).
Table
2. Privately insured population under age 65—Health maintenance organization (HMO) enrollment as a percent of total insured, by sociodemographic characteristics: United States, first half of 1996
Sociodemographic Characteristics
|
Privately insured population in thousands |
Percent enrolled in HMOs |
| Total |
159,235 |
47.6 |
| All children 18 years and under |
47,730 |
49.5 |
| All adults 19-64 years |
111,504 |
46.8 |
| Age in years |
|
|
| Under 5 |
14,834 |
51.7 |
| 6-12 |
18,054 |
50.3 |
| 13-18 |
14,843 |
46.5 |
| 19-24 |
11,563 |
46.5 |
| 25-34 |
27,698 |
50.0 |
| 35-44 |
32,049 |
49.2 |
| 45-54 |
24,785 |
46.2 |
| 55-64 |
15,410 |
36.9 |
| Sex |
|
|
| Female |
80,646 |
48.6 |
| Male |
78,589 |
46.6 |
| Sex by Age |
|
|
| Female, 19-44 |
36,608 |
51.0 |
| Female, 45-64 |
20,678 |
42.9 |
| Male, 19-44 |
34,702 |
47.0 |
| Male, 45-64 |
19,517 |
42.3 |
| Race/ethnicity |
|
|
| Hispanic a |
11,998 |
62.0 |
| Black |
15,124 |
57.6 |
| White |
132,112 |
45.1 |
| Poverty Status b |
|
|
| Poor/near poor |
10,295 |
41.8 |
| Low income |
17,101 |
43.4 |
| Middle income |
60,874 |
47.6 |
| High income |
|
|
| Education Level c |
|
|
| Less than high school grad |
10,266 |
45.1 |
| High school grad |
36,876 |
44.7 |
| Some college |
29,535 |
49.6 |
| College degree or more |
34,452 |
47.0 |
| Marital Status |
|
|
| Marriedc |
73,748 |
45.7 |
| Widowed, divorced, or separated |
14,199 |
50.1 |
| Never married |
23,455 |
48.0 |
| Insurance status |
|
|
| Private only |
154,106 |
47.7 |
| Private plus public |
5,128 |
43.6 |
| Region |
|
|
| Northeast |
32,113 |
51.2 |
| Midwest |
40,163 |
37.8 |
| South |
53,029 |
44.9 |
| West |
33,929 |
59.9 |
| Metropolitan statistical area (MSA) |
|
|
| MSA |
130,693 |
51.6 |
| Non-MSA |
28,542 |
29.3 |
| Perceived health status |
|
|
| Excellent or very good |
118,375 |
47.3 |
| Good |
30,868 |
48.5 |
| Fair |
7,709 |
48.1 |
| Poor |
2,168 |
46.8 |
| Perceived mental health status |
|
|
| Excellent or very good |
131,730 |
47.5 |
| Good |
23,081 |
47.6 |
| Fair or poor |
4,276 |
51.9 |
| IADL or ADL assistance d |
|
|
| Needs assistance |
1,769 |
40.3 |
| No assistance needed |
157,466 |
47.7 |
| Limitationse |
|
|
| Any limitation |
5,129 |
43.3 |
| No limitation |
141,856 |
47.4 |
a Includes
Hispanics of all races; the other race/ethnicity categories exclude
Hispanics.
b Limited to persons insured in Round 1 who reported
annual family income. Poor indicates family income is less than
100 percent of the poverty line, near poor indicates family income
is 100 to less than 125 percent of poverty, low income indicates
family income is 125 to less than 200 percent of poverty, middle
income indicates family income is 200 to less than 400 percent
of poverty, and high income indicates family income is 400 percent
or more of poverty.
c Age 19 and over.
d Needs help in one or more instrumental activities
of daily living (such as shopping) or activities of daily living
(such as bathing).
e Includes limitations in work, school, and housework
for persons age 5 and over.
Source: Center
for Financing, Access, and Cost Trends, Agency for Healthcare
Research and Quality: Medical Expenditure Panel Survey Household
Component, 1996 (Round 1).
Table 3. Publicly insured population under age 65—Health maintenance organization (HMO) enrollment as a percent of total insured, by sociodemographic characteristics: United States, first half of 1996
Sociodemographic Characteristics
|
Publicly insured population in thousands |
Percent enrolled in any HMOs |
Percent Enrolled in HMO through Medicaid |
| Total |
26,131 |
36.5 |
35.6 |
| All children 18 years and under |
14,460 |
40.1 |
40.0 |
| All adults 19-64 years |
11,671 |
32.2 |
30.1 |
| Age in years |
|
|
|
| Under 5 |
5,854 |
40.3 |
40.2 |
| 6-12 |
5,630 |
42.3 |
42.1 |
| 13-18 |
2,976 |
65.4 |
35.4 |
| 19-24 |
1,743 |
41.7 |
40.7 |
| 25-34 |
3,068 |
34.0 |
33.5 |
| 35-44 |
2,946 |
38.6 |
38.0 |
| 45-54 |
1,998 |
22.9 |
18.3 |
| 55-64 |
1,917 |
20.4 |
15.4 |
| Sex |
|
|
|
| Female |
14,262 |
36.9 |
35.9 |
| Male |
11,869 |
36.0 |
35.2 |
| Sex by Age |
|
|
|
| Female, 19-44 |
5,069 |
42.4 |
41.6 |
| Female, 45-64 |
2,177 |
22.9 |
18.2 |
| Male, 19-44 |
2,687 |
28.2 |
27.7 |
| Male, 45-64 |
1,737 |
20.2 |
15.3 |
| Race/ethnicity |
|
|
|
| Hispanic a |
5,300 |
35.0 |
34.4 |
| Black |
7,427 |
36.8 |
36.7 |
| White |
13,404 |
37.0 |
35.4 |
| Poverty Status b |
|
|
|
| Poor/near poor |
18,352 |
34.1 |
33.5 |
| Low income |
4,168 |
34.9 |
33.3 |
| Middle income |
2,376 |
38.5 |
36.5 |
| High income |
1,217 |
44.4 |
42.2 |
| Education Level c |
|
|
|
| Less than high school graduate |
5,010 |
28.0 |
26.3 |
| High school grad |
4,224 |
37.9 |
35.5 |
| Some college or more |
2,281 |
31.2 |
29.5 |
| Marital Status |
|
|
|
| Marriedc |
3,883 |
34.9 |
31.8 |
| Widowed, divorced, or separated |
3.636 |
32.9 |
30.6 |
| Never married |
4,153 |
29.0 |
28.1 |
| Insurance status |
|
|
|
| Medicaid only |
23,328 |
39.0 |
39.0 |
| Medicare only |
1,586 |
11.7 |
0.0 |
| Medicaid plus Meidcare |
1,217 |
20.8 |
15.2 |
| Region |
|
|
|
| Northeast |
5,312 |
34.7 |
33.7 |
| Midwest |
5,207 |
36.3 |
34.9 |
| South |
8,526 |
27.3 |
26.6 |
| West |
7,085 |
49.2 |
48.2 |
| Metropolitan statistical area (MSA) |
|
|
|
| MSA |
19,976 |
40.4 |
39.3 |
| Non-MSA |
6,154 |
24.0 |
23.6 |
| Perceived health status |
|
|
|
| Excellent or very good |
13,097 |
40.0 |
39.6 |
| Good |
7,065 |
38.6 |
38.1 |
| Fair |
3,693 |
26.3 |
24.8 |
| Poor |
2,187 |
26.9 |
21.6 |
| Perceived mental health status |
|
|
|
| Excellent or very good |
15,901 |
39.6 |
38.9 |
| Good |
6,634 |
34.5 |
33.1 |
| Fair or poor |
3,507 |
26.5 |
25.4 |
| IADL or ADL assistance d |
|
|
|
| Needs assistance |
1,983 |
24.7 |
21.0 |
| No assistance needed |
24,148 |
37.5 |
36.8 |
| Limitationse |
|
|
|
| Any limitation |
4,450 |
24.8 |
20.6 |
| No limitation |
16,723 |
38.4 |
38.0 |
a Includes
Hispanics of all races; the other race/ethnicity categories exclude
Hispanics.
b Limited to persons insured in Round 1 who reported
annual family income. Poor indicates family income is less than
100 percent of the poverty line, near poor indicates family income
is 100 to less than 125 percent of poverty, low income indicates
family income is 125 to less than 200 percent of poverty, middle
income indicates family income is 200 to less than 400 percent
of poverty, and high income indicates family income is 400 percent
or more of poverty.
c Age 19 and over.
d Needs help in one or more instrumental activities
of daily living (such as shopping) or activities of daily living
(such as bathing).
e Includes limitations in work, school, and housework
for persons age 5 and over.
Source: Center
for Financing, Access, and Cost Trends, Agency for Healthcare
Research and Quality: Medical Expenditure Panel Survey Household
Component, 1996 (Round 1).
Table 4. Medicare beneficiaries age 65 and older—Health maintenance organization (HMO) enrollment as a percent of total insured by sociodemographic characteristics: United States, first half of 1996
Sociodemographic Characteristics
|
Elderly Medicare population in thousands |
Percent enrolled in any HMO |
Percent enrolled in Medicare HMO |
Percent enrolled in private HMO |
| Total |
31,171 |
20.0 |
14.3 |
10.8 |
| Age in years |
|
|
|
|
| 65-74 |
17,709 |
23.2 |
15.7 |
13.4 |
| 75-84 |
10,931 |
16.2 |
12.8 |
7.4 |
| 85 and older |
2,531 |
13.8 |
11.0 |
6.8 |
| Sex |
|
|
|
|
| Female |
18,210 |
19.7 |
14.2 |
9.9 |
| Male |
12,961 |
20.3 |
14.6 |
12.1 |
| Sex by Age |
|
|
|
|
| Female, 65-74 |
9,830 |
22.9 |
15.5 |
11.8 |
| Female, 75 and over |
8,379 |
16.0 |
12.6 |
7.6 |
| Male, 65-74 |
7,878 |
23.5 |
16.0 |
15.5 |
| Male, 75 and over |
5,083 |
15.4 |
12.4 |
6.8 |
| Race/ethnicity |
|
|
|
|
| Hispanic a |
1,419 |
32.3 |
23.0 |
7.8 |
| Black |
2,613 |
20.6 |
13.4 |
8.7 |
| White and other |
27,139 |
19.3 |
14.0 |
11.1 |
| Poverty Status b |
|
|
|
|
| Poor/near poor |
6,232 |
15.5 |
11.7 |
5.4 |
| Low income |
6,945 |
24.4 |
18.3 |
14.0 |
| Middle income |
10,406 |
22.6 |
17.3 |
13.5 |
| High income |
7,588 |
21.2 |
14.3 |
12.2 |
| Education Level |
|
|
|
|
| Less than high school graduate |
11,976 |
18.9 |
14.0 |
8.4 |
| High school graduate |
10,137 |
20.5 |
14.8 |
12.1 |
| Some college |
4,147 |
23.3 |
17.3 |
14.8 |
| College degree or more |
4,276 |
19.4 |
12.0 |
11.0 |
| Marital Status |
|
|
|
|
| Married |
17,383 |
20.4 |
14.4 |
12.1 |
| Not marriedc |
13,756 |
19.5 |
14.3 |
9.2 |
| Insurance status |
|
|
|
|
| Medicare only |
8,744 |
20.6 |
20.6 |
0.0 |
| Medicare plus other public |
3,223 |
15.8 |
10.3 |
0.0 |
| Medicare plus private |
19,204 |
20.4 |
12.2 |
17.5 |
| Region |
|
|
|
|
| Northeast |
6,723 |
17.1 |
11.9 |
8.1 |
| Midwest |
7,669 |
14.5 |
8.4 |
8.8 |
| South |
10,904 |
14.6 |
9.1 |
6.8 |
| West |
5,875 |
40.4 |
34.7 |
23.7 |
| Metropolitan statistical area (MSA) |
|
|
|
|
| MSA |
23,848 |
24.0 |
17.6 |
13.0 |
| Non-MSA |
7,322 |
6.8 |
3.8 |
3.7 |
a Includes
Hispanics of all races; the other race/ethnicity categories exclude
Hispanics.
b Limited to persons insured in Round 1 who reported
annual family income. Poor indicates family income is less than
100 percent of the poverty line, near poor indicates family income
is 100 to less than 125 percent of poverty, low income indicates
family income is 125 to less than 200 percent of poverty, middle
income indicates family income is 200 to less than 400 percent
of poverty, and high income indicates family income is 400 percent
or more of poverty.
c Includes widowed, divorced, separated, and never
married.
d Needs help in one or more instrumental activities
of daily living (such as shopping) or activities of daily living
(such as bathing).
e Includes limitations in work, school, and housework.
Note: A person
can be enrolled in an HMO directly through Medicare as part of
the Medicare + Choice program. Such people are said to be enrolled
in Medicare HMOs. Another way a Medicare recipient can be enrolled
in an HMO is through a supplemental insurance policy, sometimes
called a Medigap plan, or through a retirement health plan offered
by a former employer.
Source: Center
for Financing, Access, and Cost Trends, Agency for Healthcare
Research and Quality: Medical Expenditure Panel Survey Household
Component, 1996 (Round 1).
^top
Technical Appendix
The data in this report were obtained in the
first round of interviews for the Household Component (HC) of the
1996 Medical Expenditure Panel Survey (MEPS). MEPS is cosponsored
by the Agency for Healthcare Research and Quality (AHRQ) and the
National Center for Health Statistics (NCHS). The MEPS HC is a
nationally representative survey of the U.S. civilian noninstitutionalized
population that collects medical expenditure data at both the person
and household levels. The focus of the MEPS HC is to collect detailed
data on demographic characteristics, health conditions, health
status, use of medical care services, charges and payments, access
to care, satisfaction with care, health insurance coverage, income,
and employment. In other components of MEPS, data are collected
on residents of licensed or certified nursing homes and from the
supply side of the health insurance market.
Survey Design
The sample for the 1996 MEPS HC was selected
from respondents to the 1995 National Health Interview Survey (NHIS),
which was conducted by NCHS. NHIS provides a nationally representative
sample of the U.S. civilian noninstitutionalized population and
reflects an oversampling of Hispanics and blacks. The MEPS HC collects
data through an overlapping panel design. In this design, data
are collected through a precontact interview that is followed by
a series of five rounds of interviews over 2 1/2 years. Interviews
are conducted with one member of each family, who reports on the
health care experiences of the entire family. Two calendar years
of medical expenditure and utilization data are collected from
each household and captured using computer-assisted personal interviewing
(CAPI). This series of data collection rounds is launched again
each subsequent year on a new sample of households to provide overlapping
panels of survey data that will provide continuous and current
estimates of health care expenditures. The reference period for
Round 1 of the MEPS HC was from January 1, 1996, to the date of
the first interview, which occurred during the period from March
through July 1996.
Health Insurance Status
The household respondent was asked if, between
January 1, 1996, and the time of the Round 1 interview, anyone
in the family was covered by any of several sources of public and
private health insurance coverage. For this report, Medicare and
CHAMPUS/CHAMPVA coverage represent coverage as of the date of the
Round 1 interview. (CHAMPUS and CHAMPVA are the Civilian Health
and Medical Programs for the Uniformed Services and Veterans Affairs.)
All other sources of insurance represent coverage at any time during
the Round 1 reference period. For additional details on health
insurance status measures in MEPS, see Vistnes and Monheit (1997).
Public Coverage
For this report, individuals are considered
to have public coverage only if they met both of the following
criteria:
- They were not covered by private insurance.
- They were covered by one of the following
public programs: Medicare, Medicaid, or other public hospital/physician
coverage.
For this report, persons with CHAMPUS are not
included in this definition of public coverage because, due to
a skip pattern in the MEPS instrument, they were not asked specifically
about HMO coverage. Persons with CHAMPUS are not included in Tables
2, 3, or 4.
In order to present a complete picture of insured persons, however,
they are included in Table 1 along
with all other insured persons. The Defense Department confirmed
that for calendar year 1996 no one covered exclusively by CHAMPUS
was enrolled in an HMO.
Private Health Insurance
Private health insurance is defined for this
report as insurance that provides coverage for hospital and physician
care, including Medigap coverage. Insurance that provides coverage
for a single service only, such as dental or vision coverage, is
not counted.
Total Insured
The total insured population shown in Table
1 includes persons covered by Medicare, Medicaid, other public
hospital/physician programs, or private hospital/physician insurance
at any time during the Round 1 reference period. For this table
only, persons covered by CHAMPUS are also included. Individuals
covered only by noncomprehensive State-specific programs (e.g.,
Maryland Kidney Disease Program) or private single-service plans
(e.g., coverage for dental or vision care only, coverage for
accidents or specific diseases) are not considered to be insured.
HMO Enrollment Status
The Agency for Healthcare Research and Quality
used cognitive interviewing methods to develop a series of questions
for the MEPS HC on the managed care characteristics of health insurance
coverage. Open-ended semi-structured interviews were administered
to a total of approximately 100 respondents through four rounds
of question development and refinement. Respondents included privately
and publicly insured individuals with a variety of managed care
type plans. Answers concerning health plan type were validated
by obtaining the health plan information from employers or other
sources. Further details of the cognitive testing are described
in Kerwin, Cantor, and Sheridan (1995).
Cognitive pretesting
confirmed that household survey respondents were often unable
to identify their health plan's
type according to a standard descriptive name or acronym, such
as: PPO (preferred provider organization), POS (point-of-service
plan), EPO (exclusive provider organization), and IPA (independent
practice association). Only one acronym, "HMO," and its
definition as a health maintenance organization was reliably understood
by a majority of respondents included in the pretest sample. As
a result of the cognitive pretesting, the MEPS HC includes a series
of questions on HMO status and managed care characteristics of
health plans. These questions are administered to MEPS household
respondents during the first round of each panel (and whenever
there has been a change in insurance coverage), with separate questions
for private, Medicaid, and Medicare plans.
In this report HMO enrollees are distinguished
from all non-HMO enrollees. Distinctions between PPO, POS, and
other types of managed care plans are not made.
a Includes all persons
covered by private insurance, Medicaid, Medicare, CHAMPUS/CHAMPVA
(Armed-Forces-related coverage), and other public hospital/physician
coverage.
b Includes Hispanics of all races; the other race/ethnicity
categories exclude Hispanics.
c Limited to persons insured in Round 1 who reported
annual family income. Poor indicates family income is less than
100 percent of the poverty line, near poor indicates family income
is 100 to less than 125 percent of poverty, low income indicates
family income is 125 to less than 200 percent of poverty, middle
income indicates family income is 200 to less than 400 percent
of poverty, and high income indicates family income is 400 percent
or more of poverty.
Source: Center for Financing, Access,
and Cost Trends, Agency for Healthcare Research and Quality: Medical
Expenditure Panel Survey Household Component, 1996 (Round 1).
a Includes Hispanics
of all races; the other race/ethnicity categories exclude Hispanics.
b Limited to persons insured in Round 1 who reported
annual family income. Poor indicates family income is less than
100 percent of the poverty line, near poor indicates family income
is 100 to less than 125 percent of poverty, low income indicates
family income is 125 to less than 200 percent of poverty, middle
income indicates family income is 200 to less than 400 percent
of poverty, and high income indicates family income is 400 percent
or more of poverty.
c Age 19 and over.
d Needs help in one or more instrumental activities
of daily living (such as shopping) or activities of daily living
(such as bathing).
e Includes limitations in work, school, and housework
for persons age 5 and over.
Source: Center
for Financing, Access, and Cost Trends, Agency for Healthcare
Research and Quality: Medical
Expenditure Panel Survey Household Component, 1996 (Round 1).
Private Insurance HMO Enrollment
A person covered by private insurance was classified
as being covered by an HMO if any of the three following conditions
were met:
- The person reported purchasing his/her insurance
directly through an HMO.
- A person reporting private insurance coverage
identified the type of insurance company as an HMO.
- The person answered yes to the following question:
Now I will ask you a few questions about how (POLICYHOLDER)'s health insurance
through (ESTABLISHMENT) works for non-emergency care.
We are interested in knowing if (POLICYHOLDER)'s (ESTABLISHMENT) plan is
an HMO, that is, a health maintenance organization. With an HMO, you must
generally receive care from HMO physicians. For other doctors, the expense
is not covered unless you were referred by the HMO or there was a medical
emergency. Is (POLICYHOLDER)'s (INSURER NAME) an HMO?
Public Insurance HMO Enrollment Excluding Medicare
A person covered by Medicaid or by some other
public program (other than Medicare) that provides hospital/physician
insurance coverage was classified as having HMO coverage if either
of the following conditions was met:
- The person picked his or her plan from a list
of Medicaid HMOs in the area.
- The person answered yes to the following question:
Under {{Medicaid/{STATE NAME FOR MEDICAID}}/the program sponsored by a State
or local government agency which provides hospital and physician benefits}
(are/is) (READ NAME(S) FROM BELOW) signed up with an HMO, that is, a health
maintenance organization?
[With an HMO, you must generally receive care from HMO physicians. If another
doctor is seen, the expense is not covered unless you were referred by the
HMO, or there was a medical emergency.]
Medicare HMO Enrollment
A person can be enrolled in an HMO directly
through Medicare as part of the Medicare + Choice program. Such
people are said to be enrolled in Medicare HMOs. Another way a
Medicare recipient could be enrolled in an HMO is through a supplemental
insurance policy, sometimes called a Medigap plan, or through a
retirement health plan offered by a former employer.
A person covered
by Medicare was classified as being covered by an HMO if either
of the following conditions
was met:
- The person identified his or her plan from
a list of Medicare HMOs in the area.
- The person answered yes to either of the following
questions:
- Now I will ask you a question about
how (PERSON)'s Medicare works for non-emergency care. (When
answering this question, please include only insurance
from Medicare, not any privately purchased insurance.)
(Are/is) (PERSON) signed up with an HMO, that is, a health maintenance
organization? With an HMO, you generally receive care from HMO physicians.
- Does Medicare require (PERSON) to sign
up with a certain primary care doctor, group of doctors,
or with a certain clinic which he or she must go to for
all routine care?
Medicare beneficiaries with additional private
insurance may be enrolled in an HMO through either Medicare or
the private insurance. They were administered the sets of managed
care questions for both private insurance and Medicare. It is possible
that Medicare beneficiaries with both private and Medicare coverage
may confuse the source of their HMO coverage. Population Characteristics
All population characteristics used in this
report come from the 1996 MEPS HC Round 1 data collection effort
except for poverty status, which comes from data collected in Round
3 as explained below.
Age
The respondent was asked to report the age
of each family member as of the date of the Round 1 interview.
Race/Ethnicity
Classification by
race and ethnicity is based on information reported for each
family member. Respondents were
asked if the race of the sample person was best described as American
Indian, Alaska Native, Asian or Pacific Islander, black, white,
or other. In this report, American Indian, Alaska Native, Asian,
and Pacific Islander are included together with white in the category
labeled "white and other."
Respondents also were asked if the sample person's
main national origin or ancestry was Puerto Rican; Cuban; Mexican,
Mexicano, Mexican American, or Chicano; other Latin American; or
other Spanish. All persons whose main national origin or ancestry
was reported in one of these Hispanic groups, regardless of racial
background, were classified as Hispanic. Since the Hispanic grouping
can include black Hispanic, white Hispanic, and other Hispanic,
the race categories of black, white, and other do not include Hispanic
persons.
Region and Place of Residence
Individuals were
identified as residing in one of four main regions—Northeast, Midwest, South, and West—in
accordance with the U.S. Bureau of the Census definition. Place
of residence either inside or outside a metropolitan statistical
area (MSA) was defined according to the U.S. Office of Management
and Budget designation, which applied 1990 standards using population
counts from the 1990 U.S. census. An MSA is a large population
nucleus combined with adjacent communities that have a high degree
of economic and social integration with the nucleus. Each MSA has
one or more central communities containing the area's main population
concentration. In New England, metropolitan areas consist of cities
and towns rather than whole counties.
Poverty Status
Unlike the other demographic characteristics
used in this study, which are drawn from the Round 1 interview,
poverty status comes from 1996 family income data collected in
Round 3. For sections of Tables 1–4 showing
HMO enrollment by poverty status, the sample was limited to persons
insured in Round 1 who also reported on sources of income in Round
3. Population estimates were further poststratified to MEPS population
estimates of the total insured population.
Family income was
constructed by summing person-level total income for all members
of the family. Person-level total
income comprises annual earnings from wages, salaries, bonuses,
tips, and commissions; business and farm gains and losses; unemployment
and worker's compensation; interest and dividends; alimony, child
support, and other private transfers; private pensions, IRA (individual
retirement account) withdrawals, social security, and veterans'
payments; Supplemental Security Income and cash welfare payments
from public assistance, Aid to Families with Dependent Children,
and Aid to Dependent Children; gains or losses from estates, trusts,
partnerships, S corporations, rent, and royalties; and a small
amount of "other" income. Logical editing or weighted,
sequential hot-deck imputation was used to impute income amounts
for missing values.
Poverty status is determined by dividing family
income by the applicable poverty line (based on family size and
composition). The resulting percentages are grouped into five categories:
Poor indicates family income less than 100 percent of the poverty
line; near poor indicates family income from 100 to less than 125
percent of poverty; low income indicates family income from 125
to less than 200 percent of poverty; middle income indicates family
income from 200 to less than 400 percent of poverty; and high income
indicates family income 400 percent of poverty or more.
a Includes Hispanics
of all races; the other race/ethnicity categories exclude Hispanics.
b Limited to persons insured in Round 1 who reported
annual family income. Poor indicates family income is less than
100 percent of the poverty line, near poor indicates family income
is 100 to less than 125 percent of poverty, low income indicates
family income is 125 to less than 200 percent of poverty, middle
income indicates family income is 200 to less than 400 percent
of poverty, and high income indicates family income is 400 percent
or more of poverty.
c Includes widowed, divorced, separated, and never
married.
d Needs help in one or more instrumental activities
of daily living (such as shopping) or activities of daily living
(such as bathing).
e Includes
limitations in work, school, and housework.
Note: A person can be enrolled in an
HMO directly through Medicare as part of the Medicare + Choice
program. Such people are said to be enrolled in Medicare HMOs.
Another way a Medicare recipient can be enrolled in an HMO is through
a supplemental insurance policy, sometimes called a Medigap plan.
Source: Center
for Financing, Access, and Cost Trends, Agency for Healthcare
Research and Quality: Medical
Expenditure Panel Survey Household Component, 1996 (Round 1).
Health Status
Perceived Health Status
Health status measures
used in this report are from Round 1 of the 1996 MEPS HC. In
every round of MEPS, the
respondent is asked to rate the health of every member of the family.
The exact wording of the question is as follows: "In general,
compared to other people of (PERSON)'s age, would you say that
(PERSON)'s health is excellent, very good, good, fair, or poor?" A
similar question is asked about mental health status.
In order to generate the estimates presented
in Tables 2, 3, and 4, it
was assumed that nonrespondents to these questions were distributed
across health states following the distribution of respondents.
Assistance with ADLs and IADLs
Questions concerning
the need for assistance in activities of daily living (ADLs)
and in instrumental activities
of daily living (IADLs) are asked in every round of MEPS. Limitations
in the ability to perform IADLs are assessed by first asking the
respondent a screening question: "Does anyone in the family
receive help or supervision using the telephone, paying bills,
taking medications, preparing light meals, doing laundry, or going
shopping?" Limitations in the ability to perform ADLs are
assessed with the following question: "Does anyone in the
family receive help or supervision with personal care such as bathing,
dressing, or getting around the house?" Follow-up questions
are asked but are not used in this analysis. For this report, the
responses to the two screening questions are combined into a single
measure of need for any type of IADL or ADL assistance.
Limitations in Work/School/Housework
These limitations
include both paid work and unpaid housework, as well as limitations
in the ability to attend
school. The relevant question asks, "Is anyone in the family
limited in any way in the ability to work at a job, do housework,
or go to school because of an impairment or a physical or mental
health problem?" (emphasis in the question as indicated).
Sample Design and Accuracy of Estimates
The sample selected
for the 1996 MEPS, which was a subsample of the 1995 NHIS, was
designed to produce national
estimates that are representative of the civilian noninstitutionalized
population of the United States. Round 1 data were obtained for
approximately 9,400 households in MEPS—comprising 23,612 individuals—which
results in a survey response rate of 78 percent. This figure reflects
participation in both NHIS and MEPS.
The statistics presented in this report are
affected by both sampling error and sources of nonsampling error,
which include nonresponse bias, respondent reporting errors, and
interviewer effects. For a detailed description of the MEPS survey
design, the adopted sample design, and methods used to minimize
sources of nonsampling error, see J. Cohen (1997), S. Cohen (1997),
and Cohen, Monheit, Beauregard, et al. (1996). The MEPS person-level
estimation weights include nonresponse adjustments and poststratification
adjustments to population estimates derived from the March 1996
Current Population Survey based on cross-classifications by region,
age, race/ethnicity, and gender.
Tests of statistical
significance were used to determine whether the differences between
populations exist
at specified levels of confidence or whether they occurred by chance.
Differences were tested using Z-scores having asymptotic normal
properties at the 0.05 level of significance. Unless otherwise
noted, only statistically significant differences between estimates
are discussed in the text.
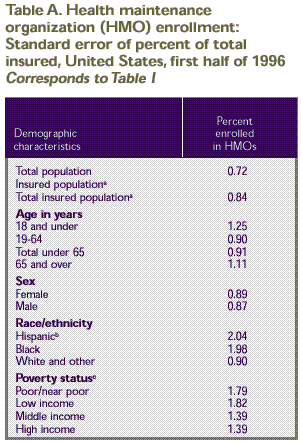
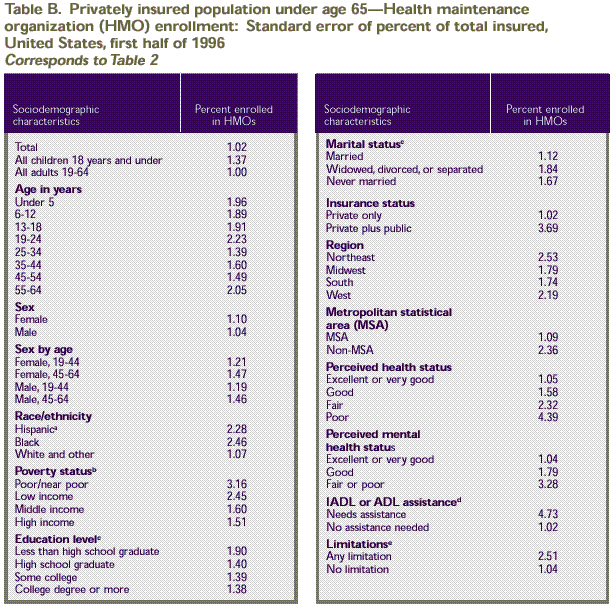
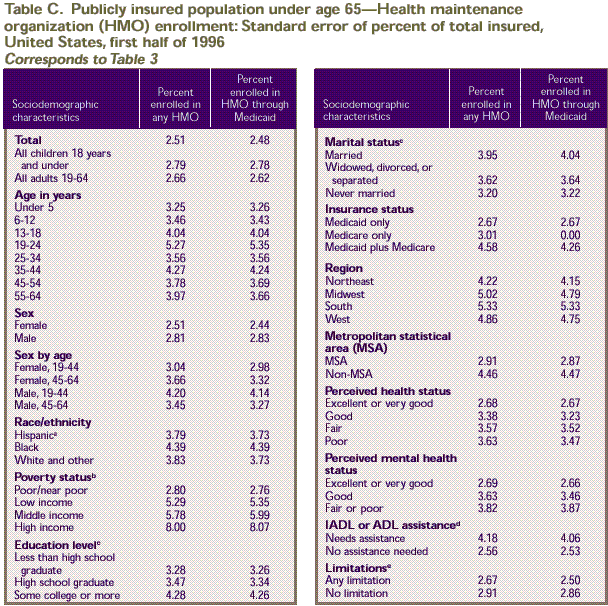
Rounding
Estimates presented
in the tables were rounded to the nearest 0.1 percent. Standard
errors, presented in Tables
A–D, were rounded to the nearest 0.01. Therefore, some
of the estimates for population totals of subgroups presented in
the tables will not add exactly to the overall estimated population
total. In addition, some of the estimates of total HMO enrollees
presented in the text of this report cannot be derived precisely
from the accompanying table because of the rounding of percents
in the tables.
HMO Enrollment: MEPS Estimates Compared With
Others
It is useful to compare MEPS estimates with
other estimates of HMO enrollment. The American Association of
Health Plans estimates that there were 67.5 million HMO enrollees
in 1996, representing about one-quarter of the population (American
Association of Health Plans, 1998). Estimates based on a census
of all HMO companies showed 58.7 million HMO enrollees as of January
1, 1996 (Interstudy, 1998). The MEPS estimate of 91.6 million persons,
or 34.8 percent of the total population, is higher than either
of these figures. As noted earlier, the MEPS data are based on
household respondents' understanding of HMO status, whereas both
of these other estimates are based on surveys of HMO companies.
It is possible that household respondents are over-reporting HMO
enrollment, perhaps describing their preferred provider organization
or other managed care plan as an HMO.
Administrative records of the number of Medicaid
HMO enrollees are not directly comparable to estimates published
in Table 3, which excludes the elderly
and Medicaid-covered persons in institutions. Nonetheless, figures
published by the Health Care Financing Administration (HCFA) provide
a useful benchmark since most Medicaid HMO enrollees are in the
community population. HCFA's administrative data show 8.6 million
Medicaid managed care enrollees as of June 1996, excluding persons
enrolled in Primary Care Case Management and carve-out plans that
do not provide a comprehensive set of benefits (Health Care Financing
Administration, 1999). The MEPS estimate of 9.5 million HMO enrollees
in Medicaid is 10 percent higher.
According to the 1995 Medicare Current Beneficiary
Survey, there were 4.38 million HMO enrollees among the Medicare
noninstitutionalized elderly population (Eppig, 1998), representing
13.9 percent of this population. These figures are directly comparable
to those shown here: 4.46 million HMO enrollees (derived from Table
4), or 14.3 percent of the noninstitutionalized Medicare population
age 65 and over (Table 4).
^top
Suggested
Citation:
Banthin, J. S. and Taylor,
A. K. Research Findings #15: HMO Enrollment in the United States: Estimates Based on Household Reports, 1996. January 2001. Agency
for Healthcare Research and Quality, Rockville,
MD.
http://www.meps.ahrq.gov/data_files/publications/rf15/rf15.shtml |
|
