
|
|
Font Size:
|
||||
|
|
|
|
||||
STATISTICAL BRIEF #274:
Variations in Perceived Need and Access to Specialist Care among Adults in the U.S. Civilian Noninstitutionalized Population, 2007
Highlights
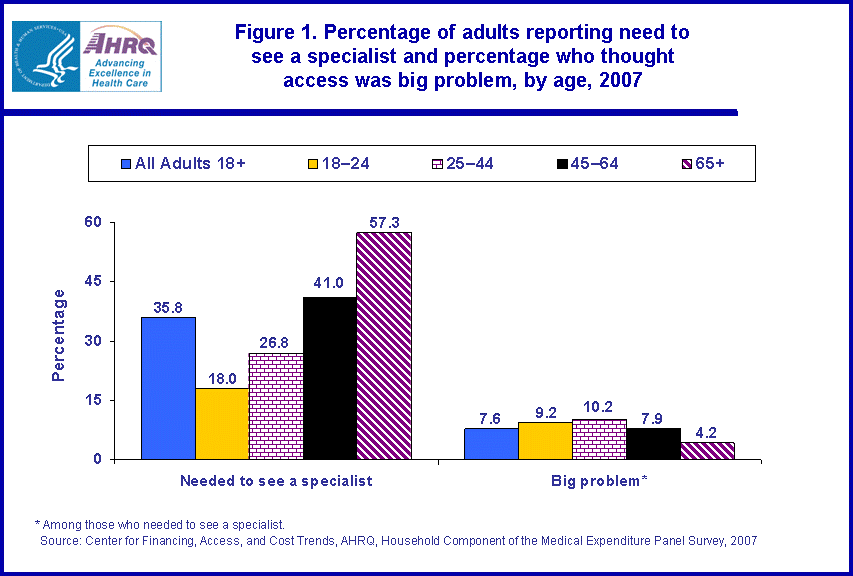
- Adults ages 25-44 were more than twice as likely as adults age 65 and over to feel it was a big problem to gain access to a specialist.
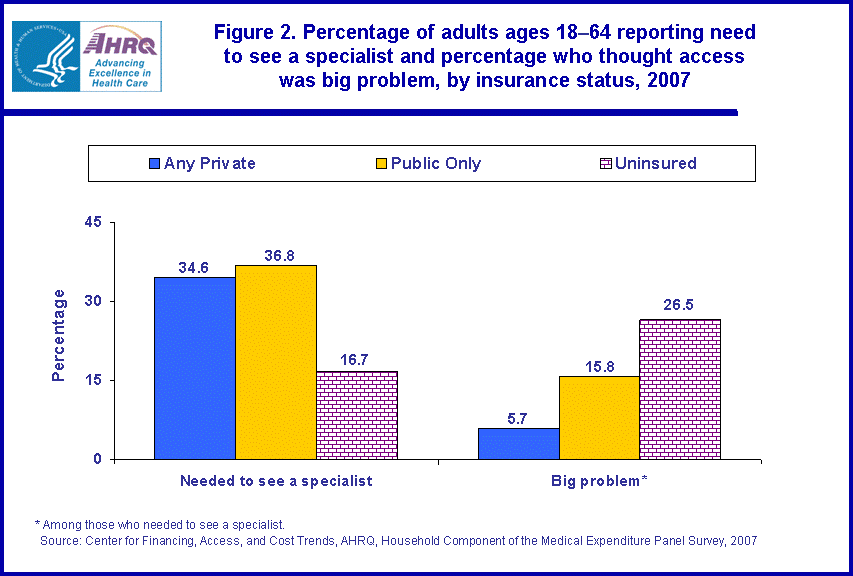
- Uninsured adults ages 18-64 were more likely to report that accessing a specialist was a big problem than their counterparts with private or public insurance coverage.
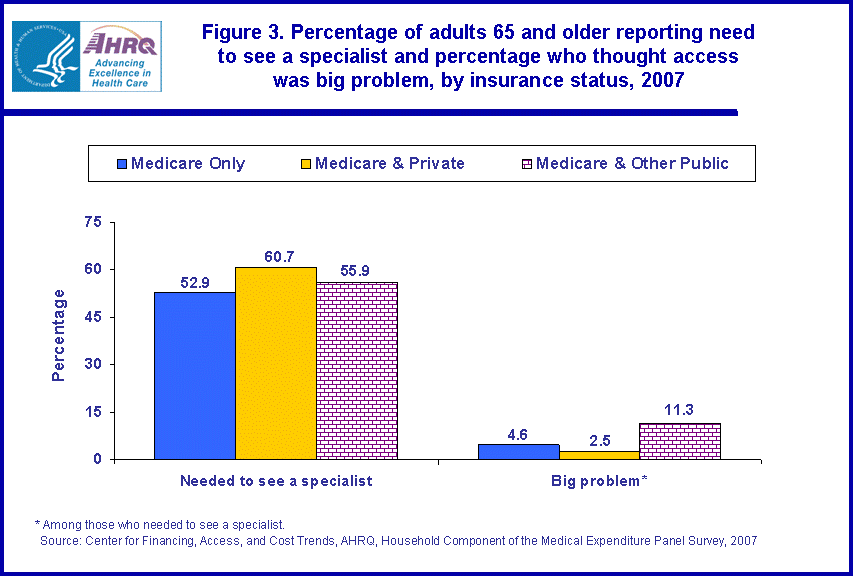
- Among elderly persons needing a specialist, those with Medicare and supplemental public insurance were much more likely to report access was a big problem than those with Medicare only or Medicare and supplemental private coverage.
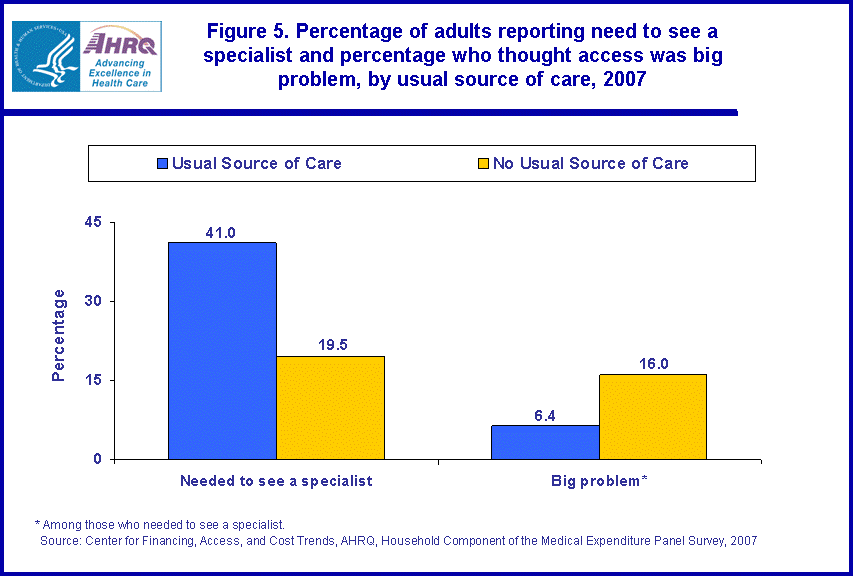
- Adults with no usual source of care were much more likely to report that access to specialist care was a big problem.
Introduction
Specialists are doctors who have completed advanced education and clinical training in a specific medical or surgical field. In 2006, more than half of the physicians in the United States were specialists, such as allergists, cardiologists, dermatologists, neurologists, oncologists, and surgeons (U.S. Census Bureau 2009). While most adults need specialty care at some time in their lives, patients with chronic conditions (Wagner et al. 2001), complications, or severe or persistent symptoms may have a particular need to see specialists (Katon et al. 2001).
Using data from the Household Component of the Medical Expenditure Panel Survey (MEPS-HC), this Statistical Brief examines variations in the perceptions of adults age 18 and over about their need for and access to physician specialists in 2007. These variations are examined across several characteristics including age, insurance coverage, the presence of selected chronic conditions (or not) and having a usual source of care (or not).
The estimates in this Brief are the opinions of the adult U.S. civilian noninstitutionalized population regarding their need to see specialists and whether it was a big problem to see a specialist (see Definitions). All comparisons discussed in the text are statistically significant at the .05 level unless otherwise noted.
Findings
Age
The likelihood of needing to see a specialist increased with age--ranging from 18.0 percent among young adults ages 18-24 to 57.3 percent of persons age 65 and over in 2007 (figure 1). However, perceived access problems among those with a reported need for specialist care generally decreased with age. For example, adults ages 25-44 were more than twice as likely as elderly adults age 65 and over to feel it was a big problem to see a specialist (10.2 percent versus 4.2 percent).
Insurance status
Although uninsured adults ages 18-64 were about half as likely to report needing to see a specialist as persons with insurance coverage (16.7 percent versus 34.6 and 36.8 percent for those with private and public insurance, respectively), they were most likely to report that accessing a specialist was a big problem (26.5 percent). Moreover, those with only public insurance were more likely to report it was a big problem (15.8 percent) than those with private insurance (5.7 percent) (figure 2).
Regardless of their extent of insurance coverage, more than half of elderly adults reported they needed to see a specialist (ranging from 52.9 percent for those with Medicare only to 60.7 percent for those with Medicare and private coverage). Among persons needing a specialist, those with Medicare and other public insurance were notably more likely to report that access was a big problem (11.3 percent) than those with Medicare only (4.6 percent) or Medicare and private coverage (2.5 percent) (figure 3).
Chronic conditions
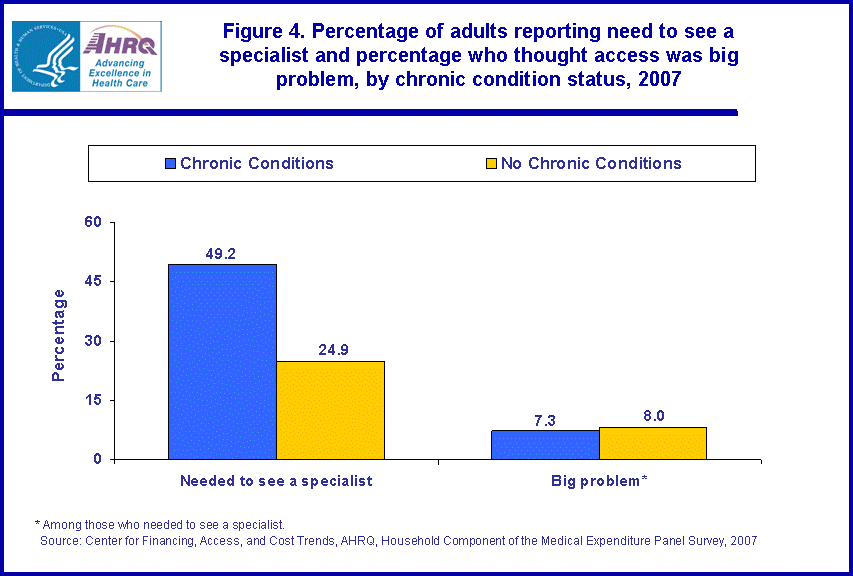
In 2007, approximately 98.6 million adults in the U.S. civilian noninstitutionalized population had ever been told by a doctor that they had one or more of the following chronic conditions: arthritis, active asthma, diabetes, emphysema, high blood pressure, ischemic heart disease, or stroke (see Definitions section). Among adults who had these chronic conditions, about half (49.2 percent) reported needing to see a specialist. In comparison, only one-quarter (24.9 percent) of those without chronic conditions perceived a need to see a specialist (figure 4). However, a similar proportion of persons with and without these chronic conditions considered access to be a big problem (7.3 versus 8.0 percent, respectively).
Usual source of care
Although adults with no usual source of care were considerably less likely to report needing a specialist as those with a usual source of care (19.5 versus 41.0 percent), they were more than twice as likely to report that access to care when needed was a big problem (16.0 versus 6.4 percent for persons with a usual source) (figure 5).
Data Source
The estimates shown in this Statistical Brief are drawn from analyses conducted by the MEPS staff from the following public use file, MEPS HC-107: 2007 Full Year Population Characteristics Data File.Definitions
Needing specialist care and access to specialists
The 2007 Self-Administered Questionnaire (SAQ), is a paper-and-pencil questionnaire that was designed to collect a variety of health status and health care quality measures of adults. The health care quality measures in the SAQ were taken from the health plan version of Consumer Assessment of Healthcare Providers and Systems (CAHPS®), an AHRQ-sponsored family of survey instruments designed to measure quality of care from the consumer's perspective.
The two questions that were examined in this Statistical Brief that relate to needing specialist care and access to specialists are:
1. Specialists are doctors like surgeons, heart doctors, skin doctors, and others who specialize in one area of health care. In the last 12 months, did you or a doctor think you needed to see a specialist?
If the response to the question above was yes, then respondents were also asked the following:
2. In the last 12 months, how much of a problem, if any, was it to see a specialist that you needed to see? A big problem, A small problem, Not a problem.
More information about CAHPS® can be obtained through the CAHPS® Web site (www.cahps.ahrq.gov).
Health insurance status
- Private insurance: This group includes those who, at any time in the survey year, had individual or group plan coverage for medical or related expenses or who were covered by TRICARE (which covers retired members of the uniformed services and the spouses and children of active-duty military). Private health insurance plans may include prepaid health plans such as health maintenance organizations but they exclude extra cash coverage plans, medical benefits linked only to specific diseases (dread disease plans), and casualty benefit plans (such as automobile insurance).
- Public coverage only: Individuals were considered to have public coverage only if they met both of the following criteria: 1) they were not covered by private insurance at any time during the year, 2) they were covered by any of the following public programs at any point during the year: Medicare, Medicaid/CHIP, or other public hospital/physician coverage.
- Uninsured: This group includes all persons who did not have private or public insurance coverage at any time in the calendar year. Persons who were covered only by non-comprehensive State-specific programs (e.g., Maryland Kidney Disease Program) or private single-service plans (e.g., coverage for dental or vision care only, coverage for accidents or specific diseases) were considered to be uninsured.
The indicator for chronic conditions was drawn from variables indicating presence of the following chronic conditions: arthritis, active asthma, diabetes, emphysema, high blood pressure, ischemic heart disease (coronary heart disease, angina, heart attack, or any other heart related disease), and stroke. For each of the conditions listed, the following question was asked: (Have/Has) PERSON ever been told by a doctor or other health professional that PERSON had [condition]. For asthma, those with an affirmative answer were further asked: (Do/Does) (PERSON) still have asthma? In this Statistical Brief, only those with active asthma (those who answered affirmatively to the follow-up question) are included among those with chronic conditions.
Usual Source of Care
For each individual family member, MEPS ascertains whether there is a particular doctor's office, clinic, health center, or other place that the individual usually goes to if he/she is sick or needs advice about his/her health.
About MEPS-HC
MEPS-HC is a nationally representative longitudinal survey that collects detailed information on health care utilization and expenditures, health insurance, and health status, as well as a wide variety of social, demographic, and economic characteristics for the U.S. civilian noninstitutionalized population. It is cosponsored by the Agency for Healthcare Research and Quality and the National Center for Health Statistics.
For more information about MEPS, call the MEPS information coordinator at AHRQ (301) 427-1656 or visit the MEPS Web site at http://www.meps.ahrq.gov.
References
For a detailed description of the MEPS-HC survey design, sample design, and methods used to minimize sources of nonsampling error, see the following publications:
Cohen, J. Design and Methods of the Medical Expenditure Panel Survey Household Component. MEPS Methodology Report No. 1. AHCPR Pub. No. 97-0026. Rockville, MD: Agency for Health Care Policy and Research, 1997. http://www.meps.ahrq.gov/mepsweb/data_files/publications/mr1/mr1.shtml
Cohen, S. Sample Design of the 1996 Medical Expenditure Panel Survey Household Component. MEPS Methodology Report No. 2. AHCPR Pub. No. 97-0027. Rockville, MD: Agency for Health Care Policy and Research, 1997. http://www.meps.ahrq.gov/mepsweb/data_files/publications/mr2/mr2.shtml
Cohen, S. Design Strategies and Innovations in the Medical Expenditure Panel Survey. Medical Care, July 2003: 41(7) Supplement: III-5-III-12.
Ezzati-Rice, T.M., Rohde, F., and Greenblatt, J. Sample Design of the Medical Expenditure Panel Survey Household Component, 1998-2007. Methodology Report No. 22. March 2008. Agency for Healthcare Research and Quality, Rockville, MD. http://www.meps.ahrq.gov/mepsweb/data_files/publications/mr22/mr22.shtml
Katon, W., M. Von Korff, E. Lin, and G. Simon. Rethinking practitioner roles in chronic illness: the specialist, primary care physician, and the practice nurse. General Hospital Psychiatry, May-June 2001, 23(3):138-144.
U.S. Census Bureau. Statistical Abstract of the United States: 2009. (128th Edition) Washington, DC, 2006.
Wagner, E. H., B. T. Austin, C. Davis, M. Hindmarsh, J. Schaefer, and A. Bonomi. Improving chronic illness care: translating evidence into action. Health Affairs, November-December 2001, 20(6):64-78.
Suggested Citation
Carper, K., and Machlin, S. Variations in Perceived Need and Access to Specialist Care among Adults in the U.S. Civilian Noninstitutionalized Population, 2007. Statistical Brief #274. December 2009. Agency for Healthcare Research and Quality, Rockville, MD. http://www.meps.ahrq.gov/mepsweb/data_files/publications/st274/stat274.shtml
AHRQ welcomes questions and comments from readers of this publication who are interested in obtaining more information about access, cost, use, financing, and quality of health care in the United States. We also invite you to tell us how you are using this Statistical Brief and other MEPS data and tools and to share suggestions on how MEPS products might be enhanced to further meet your needs. Please e-mail us at mepsprojectdirector@ahrq.hhs.gov or send a letter to the address below:
Steven B. Cohen, PhD, Director
Center for Financing, Access, and Cost Trends
Agency for Healthcare Research and Quality
540 Gaither Road
Rockville, MD 20850
 |
||||||||||||||||||||||||
|
||||||||||||||||||||||||
|
|
||||||||||||||||||||||||
 |
||||||||||||||||||||||||
|
||||||||||||||||||||||||
|
|
||||||||||||||||||||||||
 |
||||||||||||||||||||||||
|
||||||||||||||||||||||||
|
|
||||||||||||||||||||||||
 |
||||||||||||||||||||||||
|
||||||||||||||||||||||||
|
|
||||||||||||||||||||||||
 |
||||||||||||||||||||||||
|
||||||||||||||||||||||||
|
|
||||||||||||||||||||||||


