
|
|
|
Font Size:
|
||||
|
|
|
|
||||
Expenditures for Key Diet-Related Health Conditions, 2021-2022
Statistical Brief #561 | May 2025 | Steven C. Hill, PhD, and Zhengyi Fang, MS
Highlights
- In 2021-22, on average, 84.1 million adults per year were treated for key diet-related conditions: cardiovascular diseases, diabetes, breast cancer, and colorectal cancer.
- Average annual expenditures to treat key diet-related conditions per adult with diet-related conditions were $3,974 in 2021-22.
- In 2021-22, an average of $334 billion per year was spent across all payers to treat key diet-related conditions among adults.
- In 2021-22, Medicare spent an average of $153 billion per year to treat key diet-related conditions, and other federal programs, such as the Veterans Administration and TRICARE, spent $13 billion per year.
- Average annual expenditures by private insurance to treat key diet-related conditions were $100 billion in 2021-22.
Introduction
Poor diet is a risk factor for some chronic conditions, including cardiovascular disease, type 2 diabetes, metabolic syndrome, some cancers, osteoporosis and low bone mass, and overweight and obesity.1 Preventing diet-related health conditions could reduce healthcare expenditures to treat these conditions.
In this Statistical Brief, data from the Household Component of the Medical Expenditure Panel Survey (MEPS-HC) are used to estimate health expenditures for key groups of diet-related health conditions: cardiovascular diseases, diabetes, breast cancer, and colorectal cancer.1 The Brief focuses on these condition groups due to their prevalence and household survey respondents' ability to accurately report these conditions and their healthcare directly related to these conditions. Average annual estimates for the civilian, noninstitutionalized population are from two years (2021-2022) to increase precision. All differences discussed in the text are statistically significant at the 0.05 level.
Findings
Adult population treated for key diet-related conditions (figure 1)
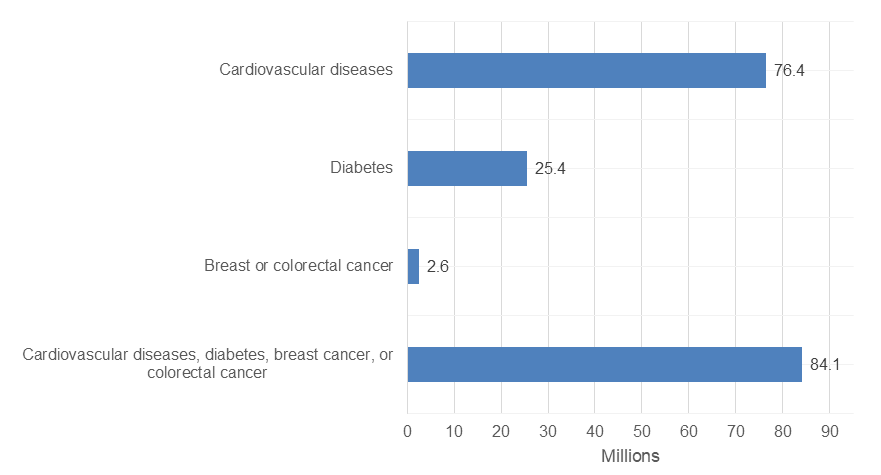
In 2021-22, on average, 84.1 million adults per year were treated for key diet-related conditions. Most of those, 76.4 million, were treated for cardiovascular diseases, such as high blood pressure, high cholesterol, coronary heart disease, cardiac dysrhythmias, or stroke. In addition, 25.4 million were treated for diabetes, and 2.6 million were treated for breast or colorectal cancer.
The overall total number of adults treated for diet-related conditions is less than the sum of the number treated for each condition group because some adults were treated for more than one diet-related condition group.
Mean expenditures to treat key diet-related conditions (figure 2)
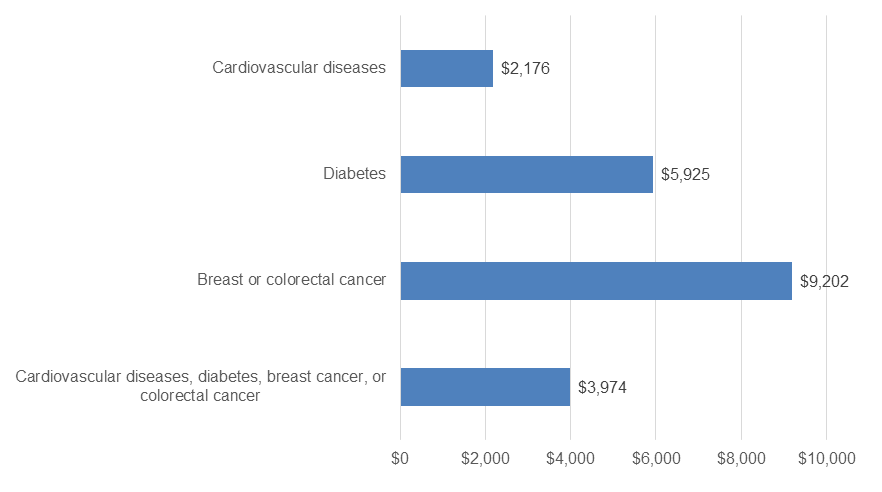
In 2021-22, the average annual expenditure to treat key diet-related conditions per adult with diet-related conditions was $3,974. In 2021-22, the average annual expenditure was $2,176 to treat cardiovascular diseases, $5,925 to treat diabetes among adults treated for diabetes, and $9,202 to treat breast cancer or colorectal cancer among adults treated for either of those cancers.
Total expenditures to treat key diet-related conditions (figure 3)
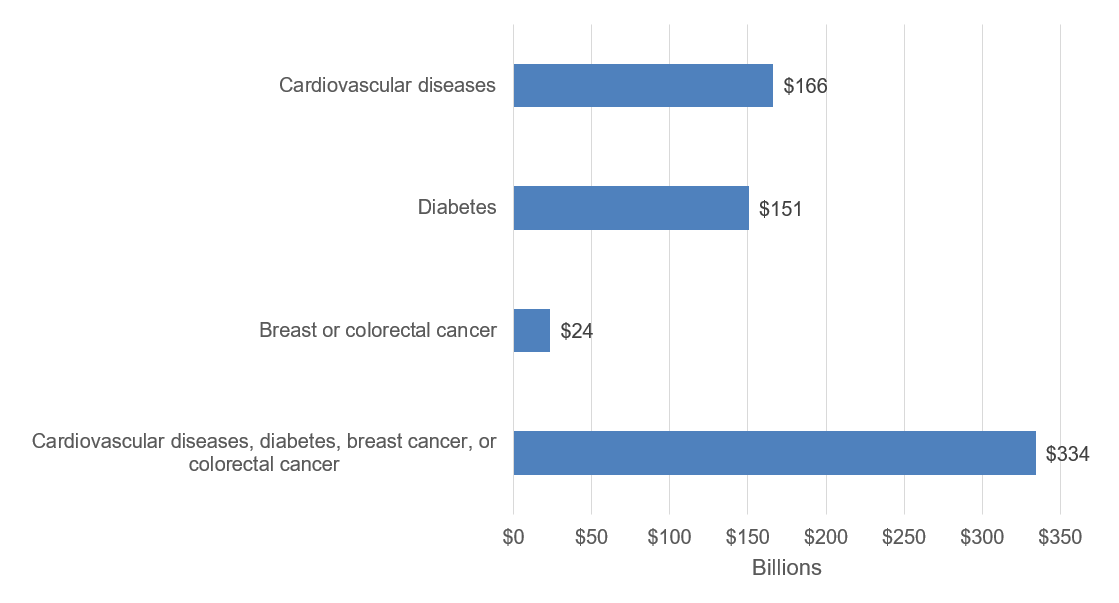
Figure 3 combines the prevalence of diet-related conditions and the mean cost of treating those conditions to show total expenditures. In 2021-22, an average of $334 billion per year was spent across all payers to treat key diet-related conditions among adults. Average annual expenditures were $166 billion per year to treat cardiovascular diseases, $151 billion to treat diabetes, and $24 billion to treat breast and colorectal cancer.
Expenditures on key diet-related conditions are less than the sum of the amount spent on each condition group, because more than one diet-related condition was treated at some visits, and expenditures for those visits are allocated to both condition groups for condition-specific estimates but count only once in the total for key diet-related conditions.
Total expenditures to treat key diet-related conditions, by payer (figure 4)
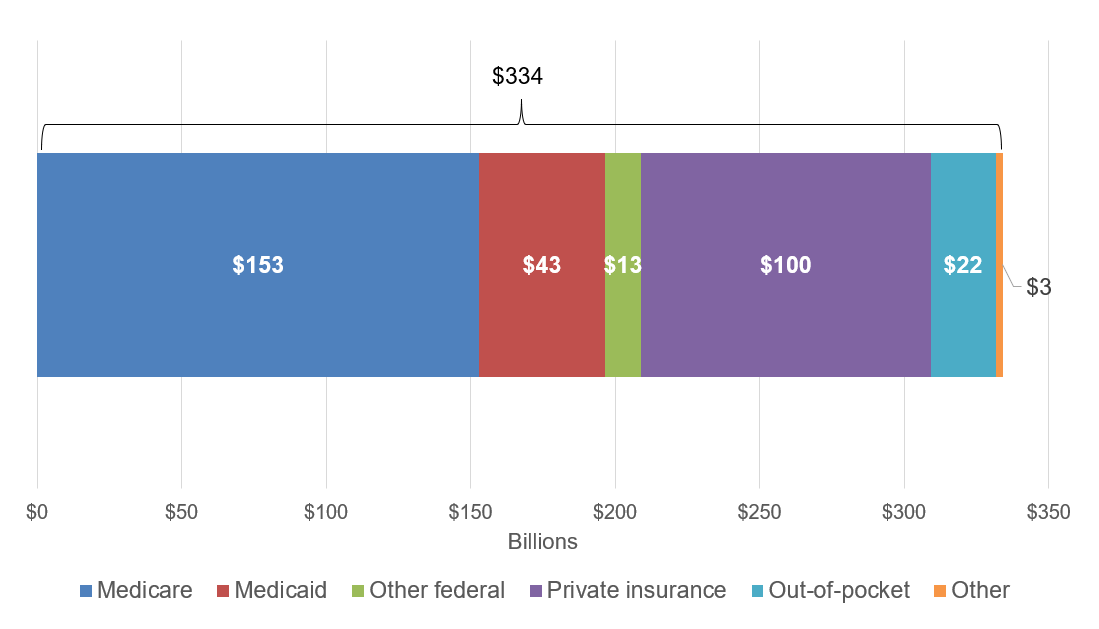
In 2021-22, Medicare spent an average of $153 billion per year to treat key diet-related conditions, and other federal programs, such as the Veterans Administration and TRICARE, spent $13 billion per year. Thus, the federal government covered half of $334 billion in total expenditures on treating key diet-related health conditions, without even including the federal government's share of the $43 billion Medicaid spent on treating these conditions. Average annual expenditures by private insurance were $100 billion, and out-of-pocket expenditures were $22 billion per year.
Data Source
The estimates shown in this Statistical Brief are based on data from the MEPS for 2021 and 2022: (a) Medical Conditions Files (H231, H241), (b) Condition-Event Link Files (H229IF1, H239IF1), (c) Office-Based Medical Provider Visits Files (H229G, H239G), (d) Outpatient Visits Files (H229F, H239F), (e) Emergency Room Visits Files (H229E, H239E), (f) Prescribed Medicines Files (H229A, H239A), (g) Hospital Inpatient Stays Files (H229D, H239D), (h) Home Health Files (H229H, H239H), and (i) Full-Year Consolidated Data Files (H233, H243). These data files are publicly available from this site: https://meps.ahrq.gov/data_stats/download_data_files.jsp.
Definitions
Adults
Age 18 or older at the end of the calendar year (or on last date of MEPS eligibility if person was out of scope at the end of the year).
Diet-related health conditions
All conditions are reported by household respondents and are not verified by medical professionals. MEPS-HC conditions reported by households were coded into International Classification of Diseases, 10th Revision, Clinical Modification (ICD-10-CM) codes, which were then collapsed into Clinical Classifications Software Refined (CCSR) categories (see https://hcup-us.ahrq.gov/toolssoftware/ccsr/dxccsr.jsp for details). Similar CCSR codes were further grouped into broader condition categories. The conditions discussed in this brief were defined as follows:
| Collapsed Condition Category | CCSRs |
|---|---|
| Cardiovascular diseases (such as high blood pressure, high cholesterol, coronary heart disease, cardiac dysrhythmias, and stroke) | CIR001-CIR011, CIR013-CIR025, END010, NVS012 |
| Breast cancer or colorectal cancer | NEO015, NEO029, NEO030 |
| Diabetes mellitus | END002-END006 |
For descriptions of each of these CCSR codes, see https://github.com/HHS-AHRQ/MEPS/blob/master/Quick_Reference_Guides/meps_ccsr_conditions.csv
Type 2 diabetes, which is influenced by diet, accounts for 91 percent of adults with diagnosed diabetes.2
Adults were classified as treated for a particular condition if they had one or more healthcare events (i.e., office-based, hospital outpatient or emergency room visits, hospital inpatient stays, prescribed medicine fills, or home healthcare) where the condition was reported as leading to or having been discovered during the event.
Expenditures for diet-related conditions
Expenditures comprise payments for medical events reported during the calendar year. Expenditures in MEPS are defined as the sum of direct payments for healthcare provided during the year, including out-of-pocket payments and payments by private insurance, Medicaid, Medicare, and other sources. Payments for over-the-counter drugs are not included in MEPS total expenditure estimates. Rebates paid by drug manufacturers to pharmacy benefit managers are not collected by the MEPS and hence not subtracted from expenditures. Indirect payments not related to specific medical events, such as Medicaid Disproportionate Share and Medicare Direct Medical Education subsidies, are also not included. Any charges associated with uncollected liability, bad debt, and charitable care (unless provided by a public clinic or hospital) are not counted as expenditures.
For each healthcare event, if the household respondent reported the event was for treatment of a diet-related condition, then all expenditures for that event were allocated to that condition, even if other conditions were also reported. The report aggregates expenditures across service categories to create a total for each combination of person and collapsed condition category.
The sum of the totals for cardiovascular disease, diabetes, breast cancer, and colorectal cancer is less than the total for the condition groups, because expenditures for events (visits, stays, drugs, etc.) associated with more than one of these conditions are used to calculate the total for each condition, but expenditures for these events are counted only once for the combined total.
To increase precision, estimates for two years were pooled. Healthcare inflation was removed by using the Personal Health Care Index from the Centers for Medicare and Medicaid Service's Office of the Actuary to inflate 2021 expenditures to 2022 dollars.3
Payers
Out of pocket: Expenses paid by the user or other family members.
Private: Includes payments made by insurance plans covering hospital and medical care (excluding payments from Medicare, Medicaid, and other public sources). Payments from Medigap plans are included.
Medicare: A federally financed health insurance plan for the elderly, persons receiving Social Security disability payments, and most persons with end-stage renal disease.
Medicaid: A means-tested government program jointly financed by federal and state funds that provides healthcare to those who are eligible.
Other Federal: Includes payments from the Department of Veterans Affairs, TRICARE, and other federal sources (Indian Health Service, military treatment facilities, and other healthcare provided by the Federal Government).
Other: Includes community and neighborhood clinics, state and local health departments, state programs other than Medicaid, payments from workers' compensation, and other unclassified sources (e.g., automobile, homeowner's, or liability insurance, and other miscellaneous or unknown sources).
About MEPS
MEPS-HC is a nationally representative longitudinal survey that collects detailed information on healthcare utilization and expenditures, health insurance, and health status, as well as a wide variety of social, demographic, and economic characteristics for the U.S. civilian noninstitutionalized population. It is cosponsored by the Agency for Healthcare Research and Quality and the National Center for Health Statistics.
The following Methodology Reports contain information on the survey and sample designs for the MEPS Household and Medical Provider Components (HC and MPC, respectively). Data collected in these two components are jointly used to derive MEPS healthcare expenditure data.
Cohen, J. Design and Methods of the Medical Expenditure Panel Survey Household Component. MEPS Methodology Report No. 1. AHCPR Pub. No. 97-0026. Rockville, MD. Agency for Healthcare Policy and Research, 1997. https://meps.ahrq.gov/data_files/publications/mr1/mr1.pdf
Chowdhury, S.R., Machlin, S.R., Gwet, K.L. Sample Designs of the Medical Expenditure Panel Survey Household Component, 1996-2006 and 2007-2016. Methodology Report #33. January 2019. Agency for Healthcare Research and Quality, Rockville, MD. https://meps.ahrq.gov/data_files/publications/mr33/mr33.shtml
Machlin, S.R., Chowdhury, S.R., Ezzati-Rice, T., DiGaetano R., Goksel H., Wun L.M., Yu W., Kashihara D. Estimation Procedures for the Medical Expenditure Panel Survey Household Component. Methodology Report #24. September 2010. Agency for Healthcare Research and Quality, Rockville, MD. https://meps.ahrq.gov/data_files/publications/mr24/mr24.shtml
Mitchell, E., Ahrnsbrak, R., Soni, A., and Machlin, S. Analyzing Medical Conditions in MEPS: User Guide (Part 1 of 2). Methodology Report #36. Rockville, MD: Agency for Healthcare Research and Quality; February 2023 https://meps.ahrq.gov/data_files/publications/mr36/mr36ug.shtml
Stagnitti, M.N., Machlin, S.R., Zodet, M.W., Saleska, E. Design, Methods, and Field Results of the Medical Expenditure Panel Survey Medical Provider Component (MEPS MPC) including the Medical Organizations Survey (MOS)-2016 Data Year. Methodology Report #32. October 2018. Agency for Healthcare Research and Quality, Rockville, MD. https://meps.ahrq.gov/data_files/publications/mr32/mr32.shtml
References
1 2025 Dietary Guidelines Advisory Committee. 2024. Scientific Report of the 2025 Dietary Guidelines Advisory Committee: Advisory Report to the Secretary of Health and Human Services and Secretary of Agriculture. U.S. Department of Health and Human Services. https://doi.org/10.52570/DGAC2025
2 Bullard K.M., Cowie C.C., Lessem S.E., Saydah S. H., Menke A., Geiss L.S., Orchard T.J., Rolka D.B., Imperatore G. Prevalence of Diagnosed Diabetes in Adults by Diabetes Type - United States, 2016. MMWR Morb Mortal Wkly Rep. 2018 Mar 30;67(12):359-361. doi: 10.15585/mmwr.mm6712a2.
3 Dunn, A., Grosse, S.D., & Zuvekas S.H. (2018). Adjusting Health Expenditures for Inflation: A Review of Measures for Health Services Research in the United States. Health Services Research, 53(1), 175-196.
Suggested Citation
Hill, S. and Fang, Z. Expenditures for Key Diet-Related Health Conditions, 2021-2022. Statistical Brief #561.
AHRQ Publication No. 25-0017-4-EF. May 2025. Agency for Healthcare Research and Quality, Rockville, MD.
https://meps.ahrq.gov/data_files/publications/st561/stat561.shtml
AHRQ welcomes questions and comments from readers of this publication who are interested in obtaining more information about access, cost, use, financing, and quality of healthcare in the United States. We also invite you to tell us how you are using this Statistical Brief and other MEPS data and tools and to share suggestions on how MEPS products might be enhanced to further meet your needs. Please email us at MEPSProjectDirector@ahrq.hhs.gov or send a letter to the address below:
Samuel H. Zuvekas, PhD, Acting Director
Center for Financing, Access and Cost Trends
Agency for Healthcare Research and Quality
5600 Fishers Lane, Mailstop 07W41A
Rockville, MD 20857
Figure 1. Average annual adult population treated for key diet-related conditions (millions), 2021-22
| Condition | Average Annual Population Treated (millions) |
|---|---|
| Cardiovascular diseases | 76.4 |
| Diabetes | 25.4 |
| Breast or colorectal cancer | 2.6 |
| Cardiovascular diseases, diabetes, breast cancer, or colorectal cancer (combined) | 84.1 |
Notes: The overall total number of adults treated for diet-related conditions is less than the sum of the
number treated for each condition group because some adults were treated for more than one diet-related condition group.
Source: Agency for Healthcare Research and Quality, Medical Expenditure Panel Survey, Household
Component, 2021-22.
Figure 2. Average annual mean expenditures to treat adults for key diet-related conditions, 2021-22
| Condition | Average Annual Mean Expenditure (USD) |
|---|---|
| Cardiovascular diseases | $2,176 |
| Diabetes | $5,925 |
| Breast or colorectal cancer | $9,202 |
| Cardiovascular diseases, diabetes, breast cancer, or colorectal cancer (combined) | $3,974 |
Notes: All expenditures inflated to 2022 dollars.
Source: Agency for Healthcare Research and Quality, Medical Expenditure Panel Survey, Household
Component, 2021-22.
Figure 3. Average annual total expenditures to treat adults for key diet-related conditions (billions), 2021-22
| Condition | Average Annual Total Expenditure (USD) |
|---|---|
| Cardiovascular diseases | $166 |
| Diabetes | $151 |
| Breast or colorectal cancer | $24 |
| Cardiovascular diseases, diabetes, breast cancer, or colorectal cancer (combined) | $334 |
Notes: Expenditures on key diet-related conditions are less than the sum of the amount spent on each
condition group, because more than one diet-related condition was treated at some visits, and
expenditures for those visits are allocated to both condition groups for condition-specific estimates but
count only once in the total for key diet-related conditions. All expenditures inflated to 2022 dollars
Source: Agency for Healthcare Research and Quality, Medical Expenditure Panel Survey, Household
Component, 2021-22.
Figure 4. Average annual total expenditures to treat adults for key diet-related conditions (billions), by payer, 2021-22
| Payer | Total Expenditures (billions USD) |
|---|---|
| Medicare | $153 |
| Medicaid | $43 |
| Other federal | $13 |
| Private insurance | $100 |
| Out-of-pocket | $22 |
| Other | $3 |
| Total | $334 |
Notes: All expenditures inflated to 2022 dollars.
Source: Agency for Healthcare Research and Quality. Medical Expenditure Panel Survey, Household Component, 2021-22.
AHRQ Pub. No. 25-0017-4-EF
May 2025