
|
|
|
Font Size:
|
||||
|
|
|
|
||||
Recent Changes in Treatment Patterns for Diagnosed or Treated Hypertension, 2018-19 to 2021-22
Statistical Brief #563 | July 2025 | Steven C. Hill, PhD, and Zhengyi Fang, MS
Highlights
- In 2021-22, on average, 90.5 million adults per year were diagnosed or currently treated for hypertension.
- Among adults ever diagnosed with or currently treated for hypertension in 2021-22, 74.5 percent obtained antihypertensive medications, including 56.5 percent who also had check-ups or ambulatory visits for hypertension, and 18.0 percent who obtained medications but did not have visits.
- Adults with diagnosed or treated hypertension were less likely to have both visits and medications in 2021-22 (56.5%) than in 2018-19 (60.2%), and they were more likely to have obtained medications without visits in 2021-22 (18.0%) than in 2018-19 (15.9%).
- In 2021-22, 15.1 percent of adults with diagnosed or treated hypertension had no medical treatment for hypertension.
- Lack of medical treatment was three times as prevalent among nonelderly adults (21.7% in 2021-22), relative to the elderly (6.9%), and was especially high for nonelderly adults who lacked a usual source of care (47.0%) or who were uninsured (48.7%).
Introduction
Nearly half of all adults (48.1%) have hypertension, commonly known as high blood pressure.1 Poor diet, physical inactivity, smoking, and inadequate sleep are among the risk factors for hypertension. Preventing hypertension could reduce healthcare expenditures on hypertension. Treating hypertension with diet, exercise, and antihypertensive medications can reduce the risk of heart attack, stroke, heart failure, and kidney disease, which are serious health problems and expensive to treat.2 Among adults with diagnosed hypertension and those unaware of their high blood pressure, lifestyle modifications alone are recommended for one out of five, with medications and lifestyle modifications recommended for the rest.1 Despite these recommendations, only half of these adults take medications. Many of the adults taking medication for hypertension still have uncontrolled high blood pressure, suggesting the need to adjust, or increase adherence to, medications.1
In this Statistical Brief, data from the Household Component of the Medical Expenditure Panel Survey (MEPS-HC) are used to estimate changes in patterns of treatment for adults with diagnosed and/or treated hypertension. Other data suggest 38 percent of adults with hypertension were not aware they had hypertension,3 but that population could not be included in this Brief. The treatment patterns we examine include ambulatory visits, including primary care and some additional check-ups, antihypertensive medications, and no medical treatment. Primary care and cardiology check-ups are included because blood pressure is routinely measured during these visits. For adults with diabetes, endocrinology check-ups are included because these doctors also treat hypertension in this population.6 Antihypertensive medications, diet, and exercise can be prescribed during these visits. Visits are important for establishing and monitoring an effective medication regimen to control blood pressure, but home monitoring is also important, and remote monitoring can send home blood pressure measures to electronic health records.3,4 Patients and pharmacies can ask physicians, physician assistants, and nurse practitioners to renew prescriptions without a visit. For those with no medical treatment for their diagnosed hypertension, the Brief reports how often they were told they had high blood pressure, an indication of the certainty of the diagnosis and perhaps the necessity of treatment.
This Brief covers the period of time after professional organizations lowered the threshold for diagnosing hypertension in 2017.5 Average annual estimates for the civilian, noninstitutionalized population are from pooled years (2018-2019 and 2021-2022) to increase precision. All differences discussed in the text are statistically significant at the 0.05 level.
Findings
Adult population diagnosed or treated for hypertension (Figure 1)
In 2021-22, on average, 90.5 million adults per year were diagnosed with or treated for hypertension, including 49.6 million ages 18 to 64 and 40.9 million ages 65 and older. These estimates are not statistically significantly different from those for 2018-19.
Treatment Patterns (Figure 2)
Ambulatory visits for hypertension are comprised of office, outpatient department, and emergency department visits to treat high blood pressure, as reported by the household respondent, and check-ups with primary care providers, cardiologists, and, for adults with diabetes, endocrinologists. Among all adults ever diagnosed with or currently treated for hypertension in 2021-22, 56.5 percent both had ambulatory visits for hypertension and obtained antihypertensive medications, 18.0 percent obtained medications but did not have visits, 10.3 percent had visits but did not obtain medications, and 15.1 percent had no medical treatment. Nearly three-quarters (74.5%) of adults, therefore, with diagnosed or treated hypertension obtained antihypertensive medications in 2021-22, which was not statistically significantly different from 2018-19 (76.2%). However, the percentage of adults who both had visits and obtained antihypertensive medications decreased from 60.2 percent in 2018-19 to 56.5 percent in 2021-22, and the percentage who had medications, but no visits, increased from 15.9 percent in 2018-19 to 18.0 percent in 2021-22. Not shown in the figure are the less than 0.1% of the adults who had hospital stays or home health for hypertension, but did not have visits or take medications.
Treatment Patterns by Age (Figure 3)
In 2021-22, among adults with diagnosed or treated hypertension, 21.7 percent of nonelderly adults (ages 18-64) did not receive medical treatment, which was three times the rate among elderly adults (ages 65 and older), 6.9 percent. Elderly adults were more likely than nonelderly adults to both have visits and obtain medications (68.8% versus 46.4%) and less likely to obtain medications without visits (16.1% versus 19.7%) or have visits but no medications (8.1% versus 12.2%).
Among adults with diagnosed or treated hypertension, treatment patterns changed for both age groups between 2018-19 and 2021-22 in the same manner as the adult population as a whole. However, among elderly adults with diagnosed or treated hypertension, 4.9 percent were not medically treated in 2018-19, rising to 6.9 percent in 2021-2022.Diagnosed but Not Medically Treated Hypertension (Figure 4)
The MEPS collected data on adults who reported being diagnosed or treated, but not those who did not know they had high blood pressure. In 2021-22, among adults with diagnosed hypertension, on average, 60.3 percent of nonelderly adults and 74.9 percent of elderly who did not report medical treatment had been told on two or more occasions that they had hypertension, which is a stronger indication that their high blood pressure was a chronic condition. Changes between 2018-19 and 2021-22 were not statistically significant.
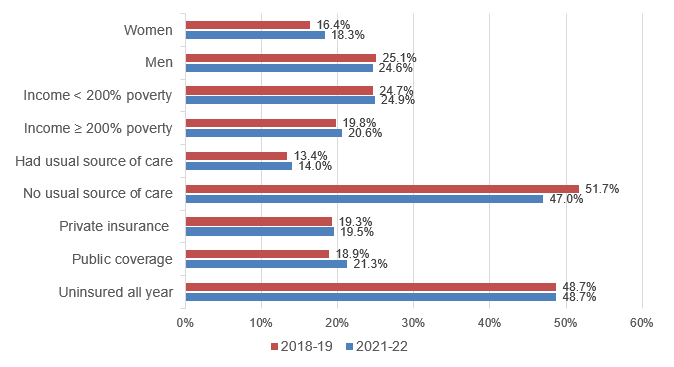
Nonelderly Adults with Diagnosed but Not Medically Treated Hypertension (Figure 5)
Among nonelderly adults with diagnosed or treated hypertension, Figure 5 shows the percentage not medically treated by demographic and other subgroups. In 2021-22, men were more likely than women to lack medical treatment for their hypertension (24.6% versus 18.3%). Nonelderly adults with family incomes below 200 percent of the Federal Poverty Line (FPL) were more likely to lack medical treatment than those with incomes at or above 200 percent of the FPL (24.9% versus 20.6%). Nearly half (47.0%) of nonelderly adults with diagnosed or treated hypertension who lacked a usual source of care had no medical treatment for their hypertension. Similarly, 48.7 percent of nonelderly adults who were uninsured the entire calendar year had no medical treatment for their hypertension.
Among nonelderly adults with diagnosed or treated hypertension who lacked a usual source of care, the share that lacked medical treatment fell from 51.7 percent in 2018-19 to 47.0 percent in 2021-22. None of the differences between the two time periods were statistically significant for any of the other subgroups examined in Figure 5.
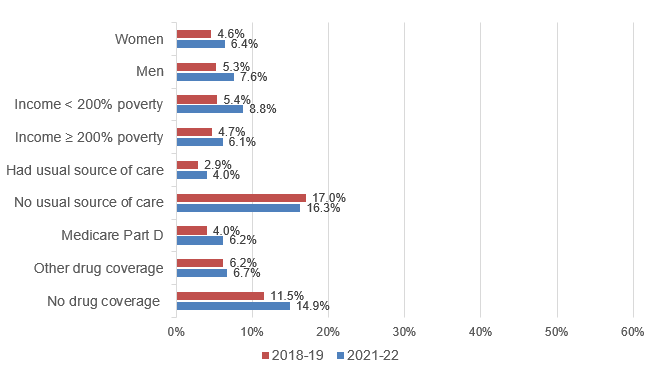
Elderly Adults with Diagnosed but Not Medically Treated Hypertension (Figure 6)
Among elderly adults with diagnosed or treated hypertension, Figure 6 shows the percentage not medically treated by demographic and other subgroups. Comparing Figures 5 and 6, elderly adults were less likely than nonelderly adults to lack medical treatment for their hypertension in both time periods for all categories for which a comparison can be made.
In 2021-22, 16.3 percent of elderly adults with diagnosed or treated hypertension who lacked a usual source of care had no medical treatment for their hypertension, which is four times the rate for those who had a usual source of care. In 2021-22, elderly adults without insurance coverage for prescription medicines were about twice as likely to lack medical hypertension treatment (14.9%) than those with Medicare Part D (6.2%) and those with private drug coverage or through the Veterans Administration (6.7%).
The increase from 2018-19 to 2021-22 in the share that lacked medical treatment was statistically significant for many elderly subgroups: women (4.6% to 6.4%), men (5.3% to 7.6%), with family incomes below 200 percent of the Federal Poverty Line (5.4% to 8.8%), with family incomes at or above 200 percent of the Federal Poverty Line (4.7% to 6.1%), had a usual source of care (2.9% to 4.0%), and had Medicare Part D drug coverage (4.0% to 6.2%).
Data Source
The estimates shown in this Statistical Brief are based on data from the MEPS for 2018, 2019, 2021, and 2022: (a) the Medical Conditions Files (H207, H214, H231, H241), (b) Condition-Event Link Files (H206IF1, H213IF1, H229IF1, H239IF1), (c) Office-Based Medical Provider Visits Files (H206G, H213G, H229G, H239G), (d) Outpatient Visits Files (H206F, H213F, H229F, H239F), (e) Emergency Room Visits Files (H206E, H213E, H229E, H239E), (f) internal versions of the Prescribed Medicines Files (H206A, H213A, H229A, H239A), (g) Hospital Inpatient Stays Files (H206D, H213D, H229D, H239D), (h) Home Health Files (H206H, H213H, H229H, H239H), and (i) Full-Year Consolidated Data Files (H209, H216, H233, H243). These data files are publicly available from this site: https://meps.ahrq.gov/data_stats/download_data_files.jsp.
Definitions
Adults
Age 18 or older at the end of the calendar year (or on last date of MEPS eligibility if person was out of scope at the end of the year).
Age groups
Elderly: Ages 65 or older at the end of the calendar year (or on last date of MEPS eligibility if person was out of scope at the end of the year).
Nonelderly: Ages 18 to 64 at the end of the calendar year (or on last date of MEPS eligibility if person was out of scope at the end of the year).
Hypertension
This statistical brief combined two ways of identifying adults with hypertension.
Diagnosed hypertension was determined by an affirmative answer to "{Have/Has} {you/{PERSON}} ever been told by a doctor or other health professional that {you/he/she} had hypertension, also called high blood pressure?" Women were asked to exclude high blood pressure during pregnancy.
For each family member who was ever told they had hypertension, the interviewer asked "{Were/Was} {you/{PERSON}} told on two or more different visits that {you/he/she} had hypertension, also called high blood pressure?" The intent of this question is to identify adults told more than once they have hypertension is to ensure the person has hypertension. Nonetheless, even among those who were told once they had hypertension, 78 percent reported obtaining antihypertensive medications, which suggests the seriousness of their diagnosis.
Treated hypertension: Adults were classified as treated for hypertension if they purchased any antihypertensive medications during the calendar year, had one or more other healthcare events (office-based, hospital outpatient or emergency room visits, hospital inpatient stays, or home healthcare) where hypertension was reported as leading to or having been discovered during the event. Adults with diagnosed hypertension were also classified as treated if they had a check-up with a primary care physician (family practice, general practice, geriatrics, or internist medicine with no subspecialty specified), mid-level practitioner (nurse practitioner or physician assistant), cardiologist, or, if they had diabetes, endocrinologist.
Conditions reported by household respondents as leading to or having been discovered during events were not verified by medical professionals. MEPS-HC conditions reported by households were coded into International Classification of Diseases, 10th Revision, Clinical Modification (ICD-10-CM) codes, which were then collapsed into Clinical Classifications Software Refined (CCSR) categories (see https://hcup-us.ahrq.gov/toolssoftware/ccsr/dxccsr.jsp for details). Conditions with CCSR code CIR007 (essential hypertension) were used for this Brief.
The MEPS did not collect information about the use of digital health applications to monitor healthy behaviors, which may have been used by some people whose medical treatment was not observed.
Treated but not diagnosed: This Brief included adults who reported obtaining antihypertensive medications but who did not report being diagnosed with hypertension. Excluding them would increase the share of adults with hypertension who were not medically treated.
Evidence suggests that adults who reported obtaining antihypertensive medications but were not diagnosed with hypertension in fact had hypertension; nonetheless, excluding them would not substantially bias estimates. They were 2 percent of the adult population, 7 percent of the adults with hypertension in this statistical brief, and 9 percent of adults who obtained antihypertensive medications. Among adults who reported obtaining antihypertensives but did not report diagnosed hypertension, one-third reported obtaining antihypertensives after their last opportunity to report diagnosed hypertension. Among this group, 45 percent reported they started using antihypertensive medications after their last opportunity to report diagnosed hypertension, including 3 percent who were women who had service use related to a pregnancy, while 55 percent were long-term users of antihypertensives. Excluding pregnant women who did not report being diagnosed with hypertension would only slightly increase the share of adults with hypertension who were not medically treated.
Alternative definition of untreated hypertension. In this Brief, the description of adults with untreated hypertension excludes adults who were not aware of their high blood pressure, who are not identified in the MEPS. Estimates from the National Health and Nutrition Examination Survey (NHANES) suggest the unaware comprise 38 percent of adults with hypertension,3 and including them would more than quadruple the untreated population. The effects of including the unaware on trends and subgroups are uncertain.
The NHANES includes clinical measures of hypertension that are not available in the MEPS. Analyses of the NHANES define hypertension as measured systolic blood pressure ≥ 130 mm Hg, diastolic blood pressure ≥ 80 mm Hg, currently taking any antihypertensive medications, or was told on two separate occasions they had hypertension.6 This definition cannot be replicated in the MEPS, which does not measure blood pressure.
Alternative definition of diagnosed hypertension. A more stringent definition of diagnosed hypertension would reduce the number of diagnosed but untreated adults with hypertension. This definition excludes adults who were not told at least twice they had hypertension and did not take any antihypertensives, thereby reducing the number of adults with diagnosed or treated hypertension by 5.0 million in 2021-22, comprised of 4.3 million nonelderly adults and 0.7 million elderly adults who were not medically treated. Thus, the rate of medically untreated hypertension among adults with diagnosed or treated hypertension would be lower, 10.1 percent in 2021-22, including 14.3 percent for nonelderly adults and 5.2 percent for elderly adults. While the levels of untreated hypertension would be lower, the patterns across subgroups would be similar.
Antihypertensive medications
Each drug that was listed as purchased or otherwise obtained was assigned to one or more therapeutic classes in the Multum Lexicon therapeutic classification system from Cerner Multum, Inc. This system identifies the six therapeutic classes of hypertension medications considered in the report (i.e., diuretics, beta blockers, calcium channel blockers, angiotensin converting enzyme (ACE) inhibitors, angiotensin II receptor blockers (ARBs), and combination therapies). Since some medications in these therapeutic classes have indications other than hypertension, we use a combination of therapeutic class and condition information to determine whether each drug fill is an antihypertensive medication.
Following are the details about which drugs and classes of drugs were always or sometimes counted as a treatment for hypertension. Diuretics and most beta blockers were included only when the respondent reported either the sample member had ever been diagnosed with hypertension, or the drug was used to treat hypertension, because medications in these classes have multiple uses. Labetolol and pindolol are two beta blockers only indicated for hypertension and were always included. Among the calcium channel blockers, nicardipine also has multiple uses and was included only when the respondent reported either the sample member was ever diagnosed with hypertension, or the drugs were used to treat hypertension. Also, among the calcium channel blockers, nimodipine is excluded because it is not indicated for treating hypertension. Among the ACE inhibitors, perindopril has multiple uses and was included only when the respondent reported either the sample member was diagnosed with hypertension, or the drug was used to treat hypertension. Some drugs in additional classes were included when the respondent reported either the sample member was ever diagnosed with hypertension or the drug was used to treat hypertension: some alpha 1 peripherally acting antiadrenergic agents (doxazosin, prazosin, terasosin), some group II antiarrhythmics (acebutolol, propranolol), renin inhibitors (aliskiren), and two vasodilators (hydralazine and oral minoxidil). Among miscellaneous antihypertensive combinations, hydralazine-isosorbide dinitrate is excluded because it is not used to treat hypertension.
Treatment Patterns
Adults with hypertension are classified into these four mutually exclusive categories based on their reported events and antihypertensive medications:
Visits and drugs: Obtained antihypertensive medications and had either (1) ambulatory visits (office based, outpatient, and emergency room visits) for hypertension, or (2) among those with diagnosed hypertension, primary care or cardiology check-ups, or, for adults also diagnosed with diabetes, endocrinology check-ups.
Visits, no drugs: Did not obtain antihypertensive medications and had either (1) ambulatory visits for hypertension or (2) among those with diagnosed hypertension, primary care or cardiology check-ups, or, for adults also diagnosed with diabetes, endocrinology check-ups.
Drugs, no visits: Obtained antihypertensive medications and had no visits for hypertension, no primary care or cardiology check-ups, and, for adults with diabetes, no endocrinology check-ups.
No medical treatment: No events for hypertension, no primary care or cardiology check-ups, no endocrinology check-ups for adults with diabetes, and did not obtain antihypertensive medications. These sample members may nonetheless have been treating their hypertension with diet, exercise, and other changes towards healthier lifestyles.
Among those who did not report visits, check-ups, or antihypertensive medications, respondents rarely reported hospital stays or home health visits for hypertension, so this category is omitted from Figures 2 and 4.
Primary care, cardiology, and endocrinology check-ups contributed substantially to the share of adults with diagnosed hypertension with each type of treatment. Among those with visits and drugs, 61 percent had check-ups but no visits linked to hypertension. Among those with visits and no drugs, 77 percent had check-ups but not visits linked to hypertension. When check-ups are excluded, 52.3 percent had medications and no visits, and 23.0 percent were medically untreated. When the medically untreated include those with check-ups but no visits reportedly for hypertension and no antihypertensives, then the patterns of use by age and other characteristics are very similar to those in Figures 5 and 6, but the rates are higher.
Income
Each sample person was classified according to the total annual income of his or her family. Possible sources of income included annual earnings from wages, salaries, bonuses, tips, and commissions; business and farm gains and losses; unemployment and Worker's Compensation; interest and dividends; alimony, child support, and other private cash transfers; private pensions, individual retirement account (IRA) withdrawals, Social Security, and Department of Veterans Affairs payments; Supplemental Security Income and cash welfare payments from public assistance and Temporary Assistance for Needy Families; gains or losses from estates, trusts, partnerships, S corporations, rent, and royalties; and a small amount of "other" income.
We report family income relative to the Federal Poverty Line (FPL), which varies with family size, age of the head of family, and family composition. It is adjusted annually for inflation. For example, in 2022, the FPL for a family of 2 adults and 2 children was $29,678 annual income. Thus, twice the FPL was $59,356 for these families in 2022.
Usual Source of Care
For each individual family member, MEPS ascertains whether there is a particular doctor's office, clinic, health center, or other place that the sample member usually visits if they are sick or need advice about their health.
Insurance coverage for the nonelderly
Any private insurance: Individuals under age 65 were classified as having any private health insurance coverage if they had private insurance that provided coverage for hospital and physician care (including TRICARE, which is Armed Forces-related coverage) at some point during the year.
Public coverage only: Individuals under age 65 were considered to have public health insurance coverage if they were not covered by private insurance or TRICARE, and were covered by Medicare, Medicaid, the Veterans Administration, or other public hospital and physician coverage at some point during the year.
Uninsured all year: Individuals under age 65 who did not have health insurance coverage for the entire calendar year were classified as uninsured. The uninsured were defined as people not covered by Medicaid, Medicare, TRICARE, other public hospital/physician programs, private hospital/physician insurance, or insurance purchased through health insurance Marketplaces. People covered only by non-comprehensive state-specific programs (e.g., Maryland Kidney Disease Program) or private single service plans such as coverage for dental or vision care only, or coverage for accidents or specific diseases, were considered uninsured.
Prescription drug coverage for the elderly
Medicare Part D: Individuals were classified as having Medicare Part D if they were covered by Medicare Part D or Medicaid at some point during the year.
Other drug coverage: Individuals were classified as having other drug coverage if they were not covered by Medicare Part D or Medicaid and were covered by private insurance that included drug coverage, TRICARE, or the Veterans Administration at some point during the year.
No drug coverage: Individuals who did not have drug coverage for the entire calendar year were classified as lacking drug coverage. This category includes people not covered by Medicare Part D, Medicaid, TRICARE, Veterans Administration, or private insurance with drug coverage at any time during the year.
About MEPS
MEPS-HC is a nationally representative longitudinal survey that collects detailed information on healthcare utilization and expenditures, health insurance, and health status, as well as a wide variety of social, demographic, and economic characteristics for the U.S. civilian noninstitutionalized population. It is cosponsored by the Agency for Healthcare Research and Quality and the National Center for Health Statistics.
The following Methodology Reports contain information on the survey and sample designs for the MEPS Household and Medical Provider Components (HC and MPC, respectively). Data collected in these two components are jointly used to derive MEPS health care expenditure data.
Cohen, J. Design and Methods of the Medical Expenditure Panel Survey Household Component. MEPS Methodology Report No. 1. AHCPR Pub. No. 97-0026. Rockville, MD. Agency for Healthcare Policy and Research, 1997. https://meps.ahrq.gov/mepsweb/data_files/publications/mr1/mr1.pdf
Chowdhury, S.R., Machlin, S.R., Gwet, K.L. Sample Designs of the Medical Expenditure Panel Survey Household Component, 1996-2006 and 2007-2016. Methodology Report #33. January 2019. Agency for Healthcare Research and Quality, Rockville, MD. https://meps.ahrq.gov/data_files/publications/mr33/mr33.shtml
Machlin, S.R., Chowdhury, S.R., Ezzati-Rice, T., DiGaetano R., Goksel H., Wun L.M., Yu W., Kashihara D. Estimation Procedures for the Medical Expenditure Panel Survey Household Component. Methodology Report #24. September 2010. Agency for Healthcare Research and Quality, Rockville, MD. http://meps.ahrq.gov/mepsweb/data_files/publications/mr24/mr25.shtml
Mitchell, E., Ahrnsbrak, R., Soni, A., and Machlin, S. Analyzing Medical Conditions in MEPS: User Guide (Part 1 of 2). Methodology Report #36. Rockville, MD: Agency for Healthcare Research and Quality; February 2023 https://meps.ahrq.gov/data_files/publications/mr36/mr36ug.shtml
Stagnitti, M.N., Machlin, S.R., Zodet, M.W., Saleska, E. Design, Methods, and Field Results of the Medical Expenditure Panel Survey Medical Provider Component (MEPS MPC) including the Medical Organizations Survey (MOS)–2016 Data Year. Methodology Report #32. October 2018. Agency for Healthcare Research and Quality, Rockville, MD. https://meps.ahrq.gov/data_files/publications/mr32/mr32.shtml
References
1 Hypertension Cascade: Hypertension Prevalence, Treatment and Control Estimates Among US Adults Aged 18 Years and Older Applying the Criteria From the American College of Cardiology and American Heart Association's 2017 Hypertension Guideline—NHANES 2017-2020. Centers for Disease Control and Prevention (CDC). May 12, 2023. Accessed (April 24, 2025). https://millionhearts.hhs.gov/data-reports/hypertension-prevalence.html.
2 U.S. Department of Health and Human Services. The Surgeon General's Call to Action to Control Hypertension. Washington, DC: U.S. Department of Health and Human Services, Office of the Surgeon General; 2020.
3 Martin, S.S., Aday, A.W., Allen, N.B., Almarzooq, Z.I., Anderson, C.A.M., Arora, P., Avery, C.L., Baker-Smith, C.M., Bansal, N., Beaton, A.Z., Commodore-Mensah, Y., Currie, M.E., Elkind, M.S.V., Fan, W., Generoso, G., Gibbs, B.B., Heard, D.G., Hiremath, S., Johansen, M.C., Kazi, D.S., Ko, D., Leppert, M.H., Magnani, J.W., Michos, E.D., Mussolino, M.E., Parikh, N.I., Perman, S.M., Rezk-Hanna, M., Roth, G.A., Shah, N.S., Springer, M.V., St-Onge, M.P., Thacker, E.L., Urbut, S.M., Van Spall, H.G.C., Voeks, J.H., Whelton, S.P., Wong, N.D., Wong, S.S., Yaffe, K., Palaniappan, L.P.; American Heart Association Council on Epidemiology and Prevention Statistics Committee and Stroke Statistics Committee. 2025. 2025 Heart Disease and Stroke Statistics: A Report of US and Global Data From the American Heart Association. Circulation. 151(8):e41-e660. doi: 10.1161/CIR.0000000000001303.
4 Shimbo, D., Artinian, N.T., Basile, J.N., Krakoff, L.R., Margolis, K.L., Rakotz, M.K., and Wozniak, G. 2020. Self-Measured Blood Pressure Monitoring at Home: A Joint Policy Statement From the American Heart Association and American Medical Association. Circulation. 142(4):e42-e63. doi: 10.1161/CIR.0000000000000803.
5 Whelton, P.K., Carey, R.M., Aronow, W.S., Casey, D.E. Jr, Collins, K.J., Dennison Himmelfarb, C., DePalma, S.M., Gidding, S., Jamerson, K.A., Jones, D.W., MacLaughlin, E.J., Muntner, P., Ovbiagele, B., Smith, S.C. Jr, Spencer, C.C., Stafford, R.S., Taler, S.J., Thomas, R.J., Williams, K.A. Sr, Williamson, J.D., Wright, J.T. Jr. 2017. ACC/AHA/AAPA/ABC/ACPM/AGS/APhA/ASH/ASPC/NMA/PCNA Guideline for the Prevention, Detection, Evaluation, and Management of High Blood Pressure in Adults: Executive Summary: A Report of the American College of Cardiology/American Heart Association Task Force on Clinical Practice Guidelines. Hypertension. 2018 Jun;71(6):1269-1324. doi: 10.1161/HYP.0000000000000066.
Suggested Citation
Hill, S. and Fang, Z. Recent Changes in Treatment Patterns for Diagnosed or Treated Hypertension, 2018-19 to 2021-22. Statistical Brief #563. AHRQ Publication No. 25-0059. July 2025. Agency for Healthcare Research and Quality, Rockville, MD. https://meps.ahrq.gov/data_files/publications/st563/stat563.pdf
AHRQ welcomes questions and comments from readers of this publication who are interested in obtaining more information about access, cost, use, financing, and quality of healthcare in the United States. We also invite you to tell us how you are using this Statistical Brief and other MEPS data and tools and to share suggestions on how MEPS products might be enhanced to further meet your needs. Please email us at MEPSProjectDirector@ahrq.hhs.govor send a letter to the address below:
Samuel H. Zuvekas, PhD, Acting Director
Center for Financing, Access and Cost Trends
Agency for
Healthcare Research and Quality
5600 Fishers Lane, Mailstop 07W41A
Rockville, MD 20857
Figures
Figure 1. Average annual adult population diagnosed or treated for hypertension (millions), by age, 2018-19 and 2021-22
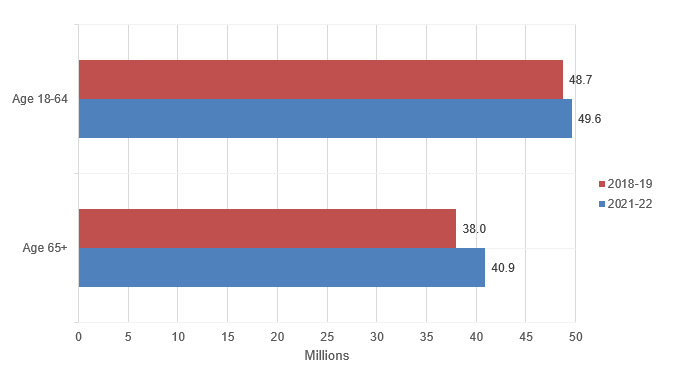
| Age Group | 2018–19 | 2021–22 |
|---|---|---|
| Age 18–64 | 48.7 | 49.6 |
| Age 65+ | 38.0 | 40.9 |
Source: Agency for Healthcare Research and Quality, Medical Expenditure Panel Survey, Household Component, 2018-19 and 2021-22.
Figure 2. Distribution of treatment patterns for adults with diagnosed or treated hypertension, 2018-19 and 2021-22
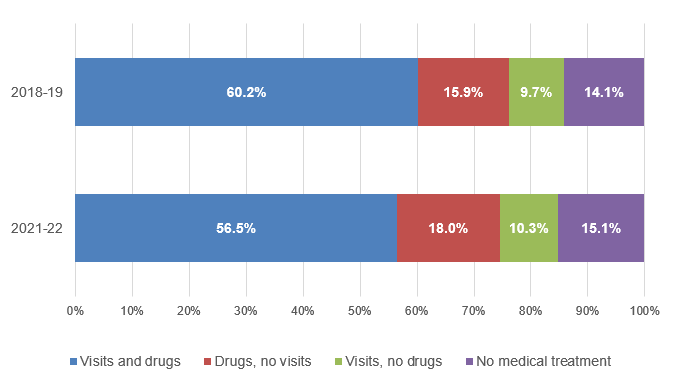
| Category | 2018–19 | 2021–22 |
|---|---|---|
| Visits and drugs | 60.2% | 56.5% |
| Drugs, no visits | 15.9% | 18.0% |
| Visits, no drugs | 9.7% | 10.3% |
| No medical treatment | 14.1% | 15.1% |
Source: Agency for Healthcare Research and Quality, Medical Expenditure Panel Survey, Household Component, 2018-19 and 2021-22.
Figure 3. Distribution of treatment patterns for adults with diagnosed or treated hypertension, by age, 2018-19 and 2021-22
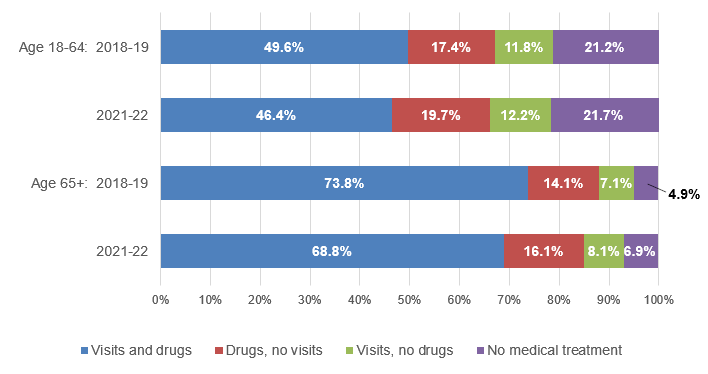
| Age Group | Age 18–64 | Age 65+ | ||
|---|---|---|---|---|
| 2018–19 | 2021–22 | 2018–19 | 2021–22 | |
| Visits and drugs | 49.6% | 46.4% | 73.8% | 68.8% |
| Drugs, no visits | 17.4% | 19.7% | 14.1% | 16.1% |
| Visits, no drugs | 11.8% | 12.2% | 7.1% | 8.1% |
| No medical treatment | 21.2% | 21.7% | 4.9% | 6.9% |
Note: Percentages may not add to exactly 100% due to rounding.
Source: Agency for Healthcare Research and Quality, Medical Expenditure Panel Survey, Household Component, 2018-19 and 2021-22.
Figure 4. Number of times diagnosed with hypertension among adults with diagnosed and untreated hypertension, by age, 2018-19 and 2021-22
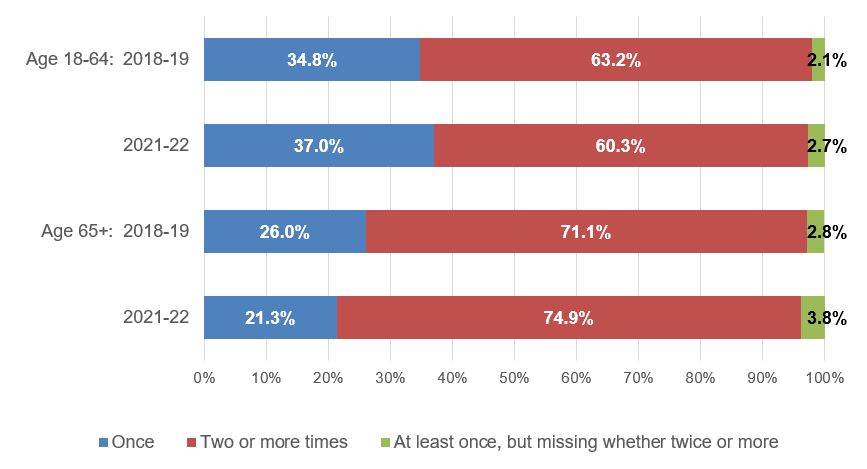
| Age Group | Age 18–64 | Age 65+ | ||
|---|---|---|---|---|
| 2018–19 | 2021–22 | 2018–19 | 2021–22 | |
| Once | 34.8% | 37.0% | 26.0% | 21.3% |
| Two or more times | 63.2% | 60.3% | 71.1% | 74.9% |
| At least once, but missing whether twice or more | 2.1% | 2.7% | 2.8% | 3.8% |
Note: Percentages may not add to exactly 100% due to rounding.
Source: Agency for Healthcare Research and Quality, Medical Expenditure Panel Survey, Household Component, 2018-19 and 2021-22.
Figure 5. Among nonelderly adults with diagnosed or treated hypertension, percent whose hypertension was not medically treated, by subgroup, 2018-19 and 2021-22
| Category | 2018–19 | 2021–22 |
|---|---|---|
| Women | 16.4% | 18.3% |
| Men | 25.1% | 24.6% |
| Income < 200% poverty | 24.7% | 24.9% |
| Income ≥ 200% poverty | 19.8% | 20.6% |
| Had usual source of care | 13.4% | 14.0% |
| No usual source of care | 51.7% | 47.0% |
| Private insurance | 19.3% | 19.5% |
| Public coverage | 18.9% | 21.3% |
| Uninsured all year | 48.7% | 48.7% |
Source: Agency for Healthcare Research and Quality, Medical Expenditure Panel Survey, Household Component, 2018-19 and 2021-22.
Figure 6. Among elderly adults with diagnosed or treated hypertension, percent whose hypertension was not medically treated, by subgroup, 2018-19 and 2021-22
| Category | 2018–19 | 2021–22 |
|---|---|---|
| Women | 4.6% | 6.4% |
| Men | 5.3% | 7.6% |
| Income < 200% poverty | 5.4% | 8.8% |
| Income ≥ 200% poverty | 4.7% | 6.1% |
| Had usual source of care | 2.9% | 4.0% |
| No usual source of care | 17.0% | 16.3% |
| Medicare Part D | 4.0% | 6.2% |
| Other drug coverage | 6.2% | 6.7% |
| No drug coverage | 11.5% | 14.9% |
Source: Agency for Healthcare Research and Quality, Medical Expenditure Panel Survey, Household Component, 2018-19 and 2021-22.
AHRQ Pub. No. 25-0059
July 2025