
|
|
Font Size:
|
||||
|
|
|
|
||||
STATISTICAL BRIEF #234:
Health Insurance Status of Full Time Workers by Demographic and Employer Characteristics, 2006
Highlights
- In 2006, 85.4 percent of the 97.7 million non-elderly, full time workers in the U.S. had private insurance, 1.9 percent had public insurance, and 12.8 percent were uninsured for the entire year.
- Workers living in high income families and workers employed in large firms had the highest rates of private insurance coverage (95.7 percent and 95.9 percent, respectively).
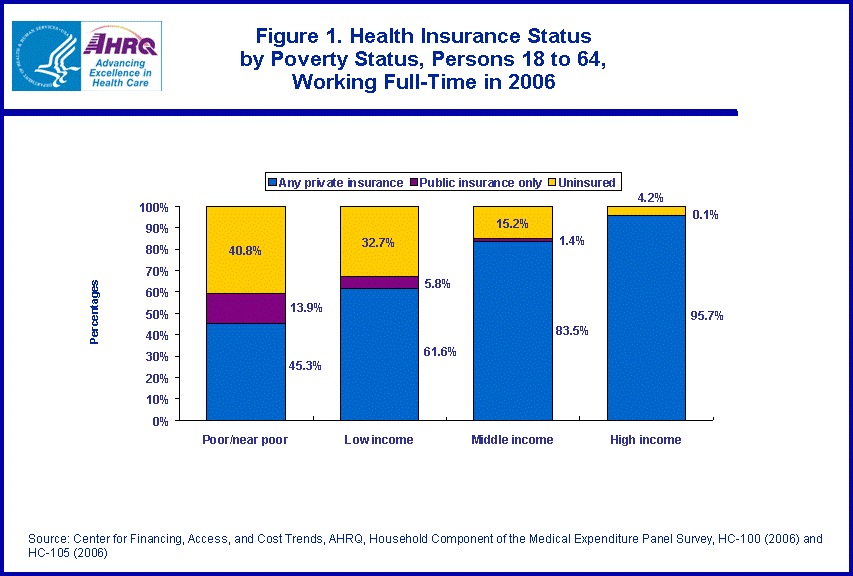
- Workers living in poor/near poor families were the least likely to have private insurance (45.3 percent), the most likely to have public insurance (13.9 percent), and the most likely to be uninsured (40.8 percent).
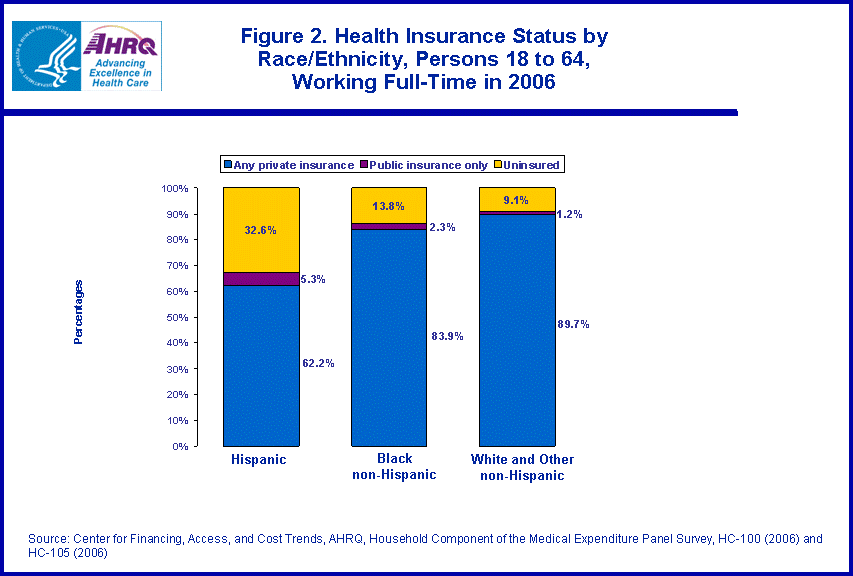
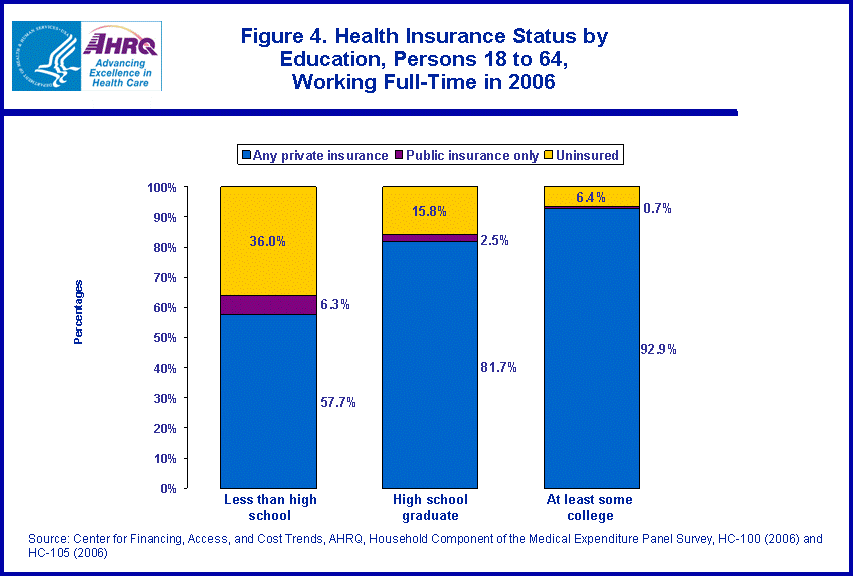
- Less than two-thirds of Hispanic workers (62.2 percent) and workers with a less than high school education (57.7 percent) had private insurance and about one-third of each group was uninsured (32.6 percent and 36.0 percent, respectively).
- Among industry groups, workers employed in natural resources/mining/construction and leisure/hospitality/other services were least likely to have private insurance and most likely to be uninsured.
Introduction
In 2006, 85.4 percent of the 97.7 million non-elderly full-time full year workers in the U.S. had private insurance at some point during the year. Among these privately insured workers, 96.9 percent had employer-sponsored coverage and 3.1 percent had individually purchased private insurance only. Although an additional 1.9 percent of workers had coverage under public insurance, 12.8 percent of all full-time full year workers--12.5 million persons--were uninsured for the entire year. 1
Estimates of the health insurance status of full time non-elderly workers in the U.S. civilian noninstitutionalized population are essential to policymakers and others concerned with the availability of insurance coverage for workers and their families. In addition to national averages, it is important to examine the substantial variation in workers' insurance status by demographic characteristics including family income, race/ethnicity, age, and education and job characteristics including the establishment size and industry of their employer.
This Statistical Brief presents data from the Household Component of the Medical Expenditure Panel Survey (MEPS-HC) for 2006 on the percentage of full time workers who had any private insurance during the year, had public insurance only, or who were uninsured for the entire year. Estimates are presented by subgroups of workers defined by demographic and job characteristics. All differences between estimates discussed in the text are statistically significant at the p < .05 level, or better.
Findings
The percentage of full time workers ages 18-64 who had private health insurance increased with family income (figure 1). Less than half (45.3 percent) of poor/near poor workers, 61.6 percent of low income workers, 83.5 percent of middle income workers and 95.7 percent of high income workers had private coverage at some point during the year. Conversely, the rate of public coverage fell across the four family income categories from a high of 13.9 percent for poor/near poor workers to a low of 0.1 percent among high income workers. Furthermore, lower income workers were more likely to be uninsured as 40.8 percent of poor/near poor workers and nearly one-third (32.7 percent) of low income workers were uninsured for the entire year compared to 15.2 percent of middle income workers and 4.2 percent of high income workers.
Hispanic workers ages 18-64 were less likely than other race/ethnicity groups to have private insurance (figure 2). Less than two-thirds (62.2 percent) of Hispanics had any private coverage, compared to 83.9 percent of black workers and 89.7 percent of white/other workers. By contrast, Hispanic workers (5.3 percent) were more likely than black (2.3 percent) and white/other workers (1.2 percent) to have public coverage only. Nearly one-third (32.6 percent) of Hispanic workers were uninsured which was more than twice the rate for black workers (13.8 percent), and more than three times the rate for white/other workers (9.1 percent). Black workers were also less likely to have private insurance, more likely to have public insurance only, and more likely to be uninsured than white/other workers.
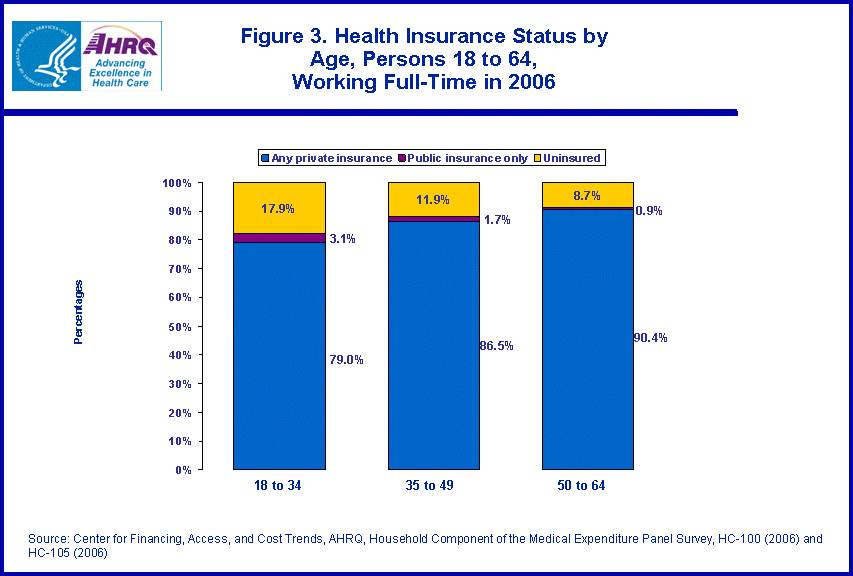
The rate of private insurance coverage increased with age as 79.0 percent of workers ages 18 to 34, 86.5 percent of workers ages 35 to 49, and 90.4 percent of workers ages 50 to 64 had private insurance at some point during the year (figure 3). The percentage of workers who had public coverage only and the percentage uninsured both declined with age as 17.9 percent of workers ages 18 to 34 were uninsured for the entire year compared to 11.9 percent of workers ages 35 to 49 and 8.7 percent of workers ages 50 to 64.
Full time workers ages 18-64 with less than a high school education were less likely than others to have any private health insurance (figure 4). Only 57.7 percent of those with less than a high school education had any private coverage, compared to 81.7 percent of high school graduates and 92.9 percent of those who attended at least some college. By contrast, workers with less than a high school education (6.3 percent) were more likely than high school graduates (2.5 percent) and workers with at least some college education (0.7 percent) to have public coverage. More than one-third (36.0 percent) of workers with less than a high school education were uninsured which was more than twice the rate for high school graduates (15.8 percent) and more than five times the rate for workers with some college education (6.4 percent). High school graduates were also less likely to have private insurance only, more likely to have public insurance and more likely to be uninsured than workers who attended at least some college.
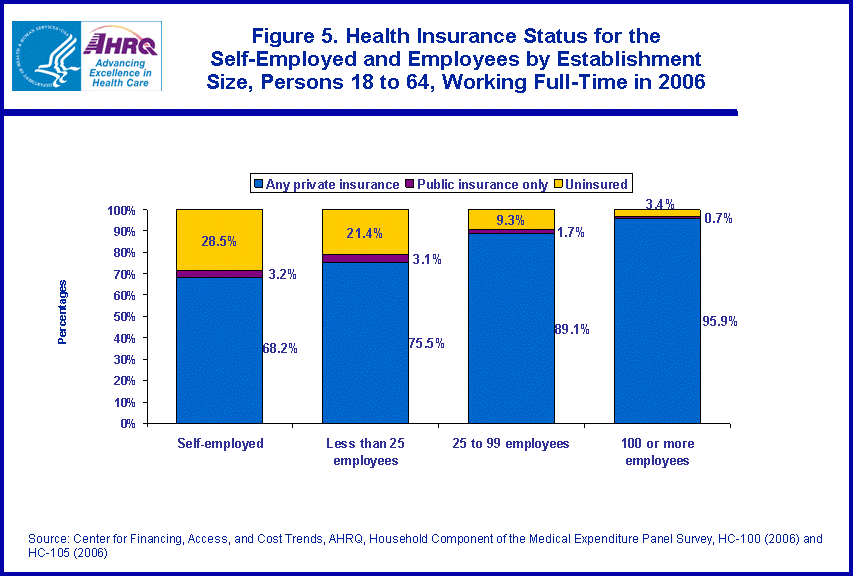
Self-employed workers were the least likely (68.2 percent) to be covered by private insurance and the most likely (28.5 percent) to be uninsured for the entire year (figure 5). Among those who worked for an employer, rates of private insurance increased with firm size as 75.5 percent of workers in small establishments (less than 25 employees), 89.1 percent of workers in medium size establishments (25 to 99 employees), and 95.9 percent of workers in large establishments (100 or more employees) had private insurance at some point during the year. More than one in five (21.4 percent) workers in small establishments were uninsured for the entire year which was more than twice the rate for employees in medium size establishments (9.3 percent) and about six times the rate for employees in large establishments (3.4 percent). Self-employed workers (3.2 percent) and employees in small establishments (3.1 percent) were also more likely than workers in medium and large establishments to have some public coverage only during the year.
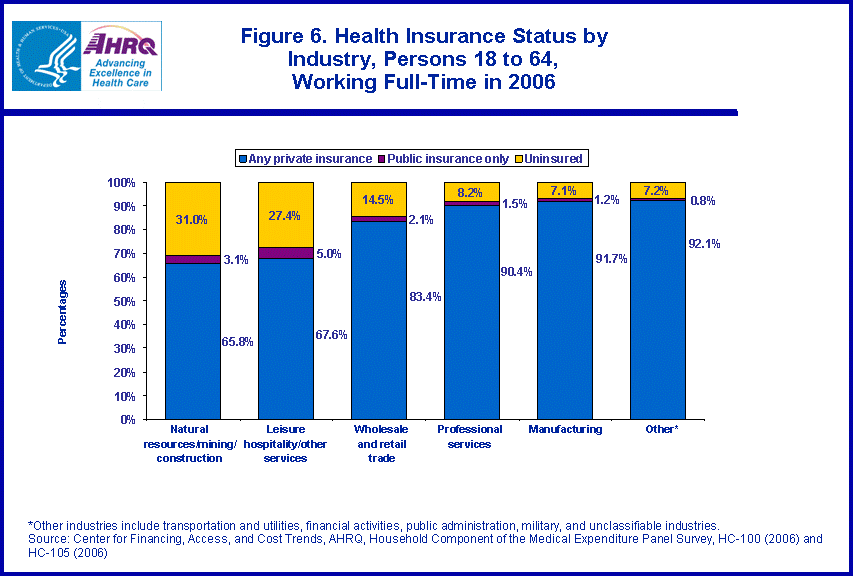
Insurance also showed substantial variation across industry categories (figure 6). Workers ages 18-64 employed in natural resources/mining/construction and leisure/hospitality/other services were less likely than other workers to have any private insurance during the year (65.8 percent and 67.6 percent, respectively) and more likely than other workers to be uninsured for the entire year (31.0 percent and 27.4 percent, respectively). Workers employed in professional services, manufacturing and 'other' industries2 were the most likely to have private coverage (more than 90 percent in all three industry categories) and the least likely to be uninsured (less than 10 percent in all three industry categories). For workers employed in wholesale and retail trade, the percentage with private insurance (83.4 percent) and the percentage uninsured (14.5 percent) fell in between the other two groups of industries described above.
Data Source
The estimates shown in this Statistical Brief are drawn from analyses conducted by the MEPS staff from the following public use files: 2006 Full Year Consolidated Data File (HC-105); 2006 Jobs File (HC-100).
Definitions
Age
Defined using the last available age for each sampled person.
Education
Measured as the highest level of education each individual has attained. We use the following three education categories:
- Less than high school: having less than 12 years of education.
- High school graduate: having 12 years of education.
- At least some college: having more than 12 years of education.
A particular workplace or location. A small establishment is defined as having fewer than 25 employees; a medium-sized establishment has 25 to 99 employees; a large establishment has 100 or more employees.
Employee
A person on the actual payroll.
Family income
Income categories are defined by the ratio of family income to the Federal income thresholds, which control for family size and age of the head of family. Poverty status was based on annual income in 2006. Family income (poverty status) categories are defined as follows:
- Poor/near poor: persons in families with income less than or equal to 125 percent of the Federal poverty line, including those who had negative income.
- Low income: persons in families with income over 125 percent through 200 percent of the Federal poverty line.
- Middle income: persons in families with income over 200 percent through 400 percent of the Federal poverty line.
- High income: Persons in families with income over 400 percent of the Federal poverty line.
A person who worked full-time (35 or more hours per week) for all 12 months of the year.
Health insurance status
Insurance for each person is categorized into one of the following three mutually exclusive categories:
- Any private insurance: this group includes those who, at any time in the survey year, had individual or group plan coverage for medical or related expenses or who were covered by TRICARE (which covers retired members of the uniformed services and the spouses and children of active-duty military). Private health insurance plans may include prepaid health plans such as health maintenance organizations but they exclude extra cash coverage plans, medical benefits linked only to specific diseases (dread disease plans), and casualty benefit plans (such as automobile insurance).
- Public insurance only: this group includes persons who were never covered by private insurance or TRICARE during the year but who were covered at any time by Medicare, Medicaid, SCHIP, or other State and local medical assistance programs.
- Uninsured: this group includes all persons who did not have private or public insurance coverage at any time in the calendar year.
Industry categories are defined as follows (Industrial Classification System Code Value in parentheses):
- Natural resources/mining/construction includes the industry categories natural resources (0170-0290), mining (0370-0490), and construction (0770).
- Leisure/hospitality/other services includes the industry categories leisure and hospitality (8560-8690), and other services (8770-9290).
- Wholesale/retail trade includes the industry category wholesale and retail trade (4070-4590 and 4670-5790).
- Professional services includes the industry categories professional and business services (7270-7790), information (6470-6780) and education, health, and social services (7860-8470).
- Manufacturing (1070-3990).
- Other includes the industry categories transportation and utilities (0570-0690 and 6070-6390), financial activities (6870-7190), public administration (9370-9590), military (9890), and unclassifiable industries (9990).
A person 18 to 64 years of age.
Race/Ethnicity
Classification by race and ethnicity is mutually exclusive and based on information reported for each family member. Respondents were asked if each family member's race was best described as white, black, Asian, American Indian, Alaska Native, native Hawaiian, Pacific Islander, or multiple races. All persons whose main national origin or ancestry was reported as Hispanic, regardless of racial background, are classified as Hispanic. All non-Hispanic persons whose race was reported as Asian, American Indian, Alaska native, native Hawaiian, or multiple races are classified in the 'other' race category. For this analysis, the following classification by race and ethnicity was used: Hispanic (of any race), black non-Hispanic, and white/other non-Hispanic.
Worker
Includes employees and the self-employed.
About MEPS-HC
MEPS-HC is a nationally representative longitudinal survey that collects detailed information on health care utilization and expenditures, health insurance, and health status, as well as a wide variety of social, demographic, and economic characteristics for the U.S. civilian noninstitutionalized population. It is cosponsored by the Agency for Healthcare Research and Quality and the National Center for Health Statistics.
For more information about MEPS, call the MEPS information coordinator at AHRQ (301-427-1656) or visit the MEPS website at http://www.meps.ahrq.gov/.
References
For a detailed description of the MEPS-HC survey design, sample design, and methods used to minimize sources of nonsampling error, see the following publications:
Cohen, J. Design and Methods of the Medical Expenditure Panel Survey Household Component. MEPS Methodology Report No. 1. AHCPR Pub. No. 97-0026. Rockville, MD. Agency for Health Care Policy and Research, 1997. http://www.meps.ahrq.gov/mepsweb/data_files/publications/mr1/mr1.shtml
Cohen, S. Sample Design of the 1996 Medical Expenditure Panel Survey Household Component. MEPS Methodology Report No. 2. AHCPR Pub. No. 97-0027. Rockville, MD. Agency for Health Care Policy and Research, 1997. http://www.meps.ahrq.gov/mepsweb/data_files/publications/mr2/mr2.shtml
Cohen, S. Design Strategies and Innovations in the Medical Expenditure Panel Survey. Medical Care, July 2003: 41(7) Supplement: III-5-III-12.
Cohen, S, Rhoades, J. Estimation of the long term uninsured in the Medical Expenditure Panel Survey. Journal of Economic and Social Measurement, 32(2007):235-249.
Ezzati-Rice, TM, Rohde, F, Greenblatt, J, Sample Design of the Medical Expenditure Panel Survey Household Component, 1998-2007. Methodology Report No. 22. March 2008. Agency for Healthcare Research and Quality, Rockville, MD. http://www.meps.ahrq.gov/mepsweb/data_files/publications/mr22/mr22.shtml
Suggested Citation
Miller, GE and Carroll, WA. Health Insurance Status of Full Time Workers by Demographic and Employer Characteristics, 2006. Statistical Brief #234. January 2009. Agency for Healthcare Research and Quality, Rockville, MD. http://www.meps.ahrq.gov/mepsweb/data_files/publications/st234/stat234.shtml
AHRQ welcomes questions and comments from readers of this publication who are interested in obtaining more information about access, cost, use, financing, and quality of health care in the United States. We also invite you to tell us how you are using this Statistical Brief and other MEPS data and tools and to share suggestions on how MEPS products might be enhanced to further meet your needs. Please e-mail us at mepspd@ahrq.gov or send a letter to the address below:
Steven B. Cohen, PhD, Director
Center for Financing, Access, and Cost Trends
Agency for Healthcare Research and Quality
540 Gaither Road
Rockville, MD 20850
1 Estimates from the 2006 Medical Expenditure Panel Survey Household Component.
2 Other industries include transportation and utilities, financial activities, public administration, military, and unclassifiable industries.
 |
||||||||||||||||||||||||||||||||||||
|
||||||||||||||||||||||||||||||||||||
|
|
||||||||||||||||||||||||||||||||||||
 |
||||||||||||||||||||||||||||||||||||
|
||||||||||||||||||||||||||||||||||||
|
|
||||||||||||||||||||||||||||||||||||
 |
||||||||||||||||||||||||||||||||||||
|
||||||||||||||||||||||||||||||||||||
|
|
||||||||||||||||||||||||||||||||||||
 |
||||||||||||||||||||||||||||||||||||
|
||||||||||||||||||||||||||||||||||||
|
|
||||||||||||||||||||||||||||||||||||
 |
||||||||||||||||||||||||||||||||||||
|
||||||||||||||||||||||||||||||||||||
|
|
||||||||||||||||||||||||||||||||||||
 |
||||||||||||||||||||||||||||||||||||
|
||||||||||||||||||||||||||||||||||||
|
|
||||||||||||||||||||||||||||||||||||


