
|
|
|
Font Size:
|
||||
|
|
|
|
||||
STATISTICAL BRIEF #300:
Restricted-Activity Days, 2007: Estimates for the U.S. Civilian Noninstitutionalized Population, Ages 16-64
Highlights
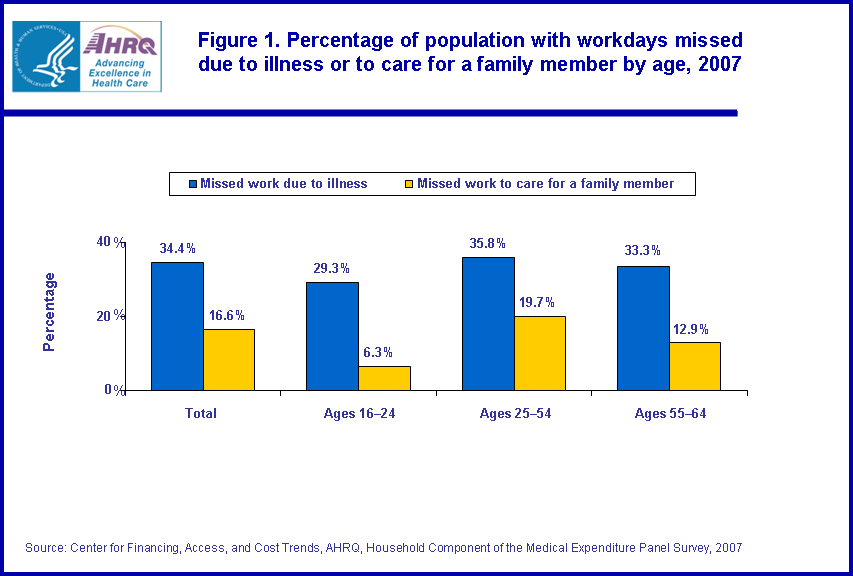
- The age group 16-24 had the lowest percentage of people with workdays lost due to illness, injury, or mental or emotional problems in the working-age population; 29.3 percent of people aged 16-24 had workdays lost.
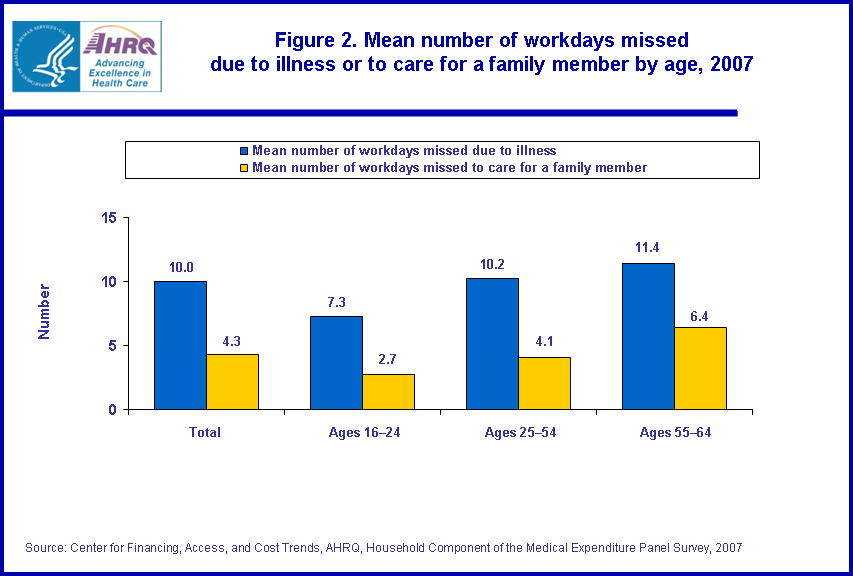
- When the age group 55-64 experienced workdays lost to care for a family member with health problems the mean number of days (6.4 annually) was the highest amongst the three age groups.
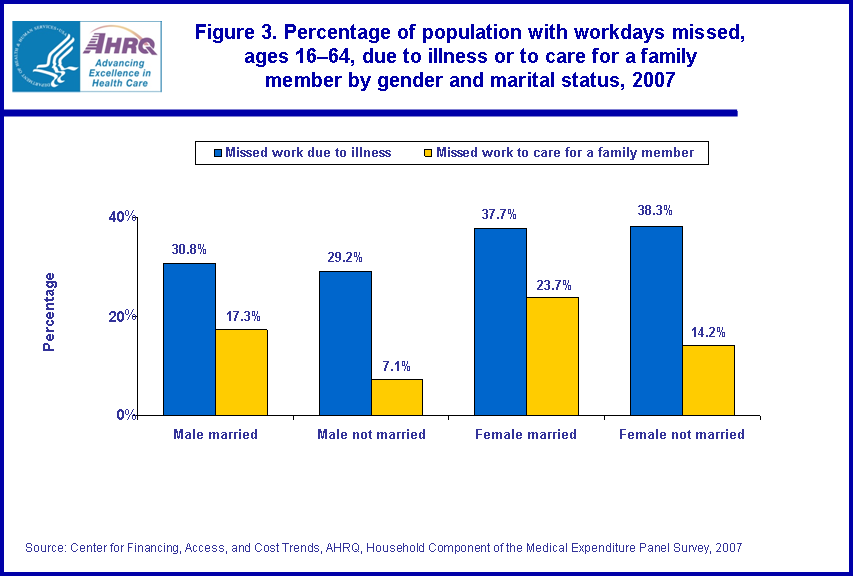
- Married females were the most likely to miss workdays to care for family members with health problems (23.7 percent). Unmarried males were the least likely to miss workdays, 7.1 percent, to care for family members with health problems.
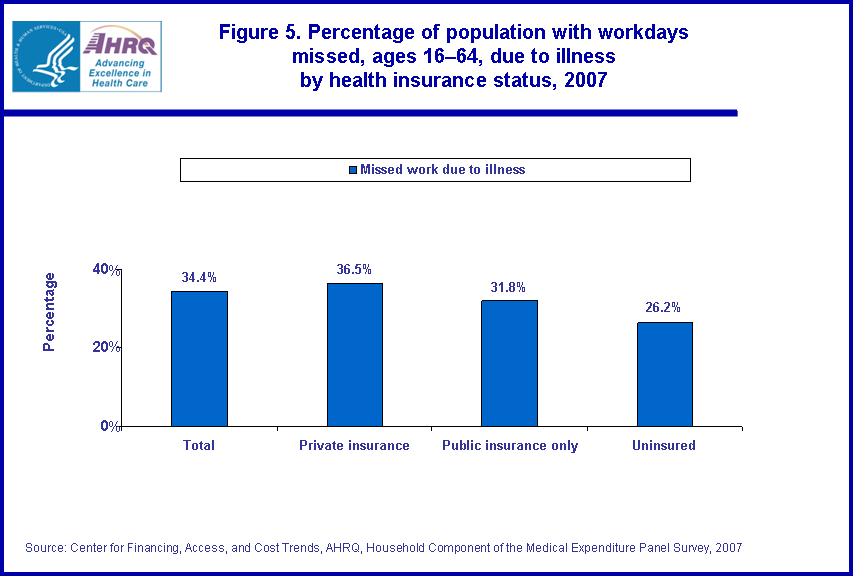
- Individuals with private health insurance were the most likely to experience workdays lost (36.5 percent). In contrast, those reporting being uninsured were the least likely to have loss of workdays (26.2 percent).
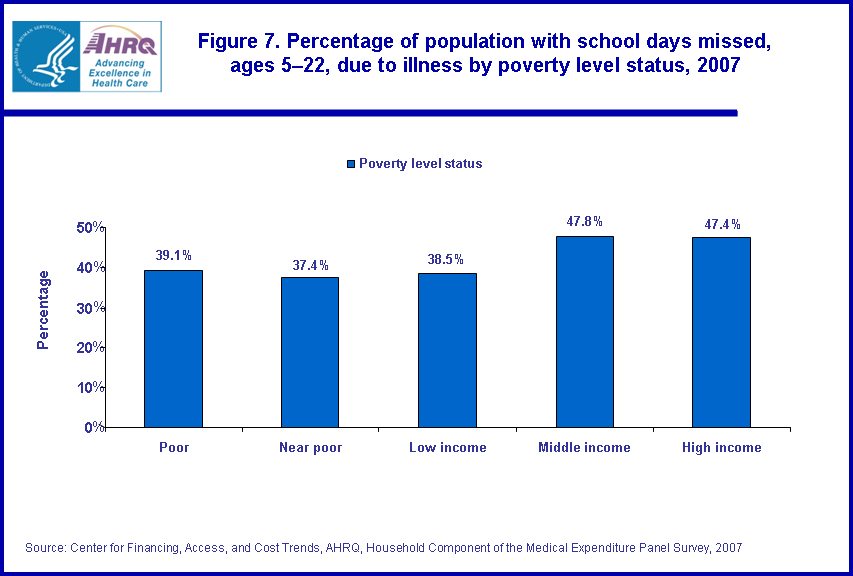
- In 2007, individuals belonging to households reporting high or middle income were more likely to report school days lost due to illness, injury, or mental or emotional problems, 47.4 and 47.8 percent, respectively, compared to the remaining income levels.
Introduction
This Statistical Brief provides estimates of restricted-activity days (workdays or school days lost due to physical illness, injury, a mental or emotional problem, or caring for a family member with health problems) for the civilian noninstitutionalized population of the United States. Data are from the 2007 Medical Expenditure Panel Survey Household Component (MEPS-HC). The percentage of the population with restricted-activity days and the mean number of restricted-activity days per year are shown in relation to selected demographic and socioeconomic characteristics. The variables shown include age, gender, marital status, health insurance status, and poverty level status.Restricted-activity days provide an indication of the burden of illness in the workplace and in school. With a greater understanding of the variation of this burden among groups, policymakers, and health care providers may be better informed. Unless otherwise noted, only statistically significant differences between estimates are discussed in the text. Differences were tested using z-scores having asymptotic normal properties at the 0.05 level of significance.
Findings
Workdays lost due to illness or to care for a family member
Age
In 2007, the age group 16-24 had the lowest percentage of people with workdays lost due to illness, injury, or mental or emotional problems in the working-age population. In 2007, 29.3 percent of people aged 16-24 had workdays lost, compared to 35.8 percent and 33.3 percent for ages 25-54 and 55-64, respectively (figure 1). In addition, when experiencing workdays lost the age group 16-24 also had the lowest mean number of days missed annually (7.3 days). This compares to 10.2 and 11.4 workdays lost annually for the age groups 25-54 and 55-64, respectively (figure 2). In contrast, those aged 25-54 were the most likely to experience workdays lost to care for a family member with health problems (19.7 percent). For the age groups 16-24 and 55-64 the estimates were 6.3 and 12.9 percent respectively (figure 1). Interestingly, when the age group 55-64 experienced workdays lost to care for a family member with health problems, the mean number of days (6.4 annually) was the highest amongst the three age groups (figure 2).
Gender and marital status
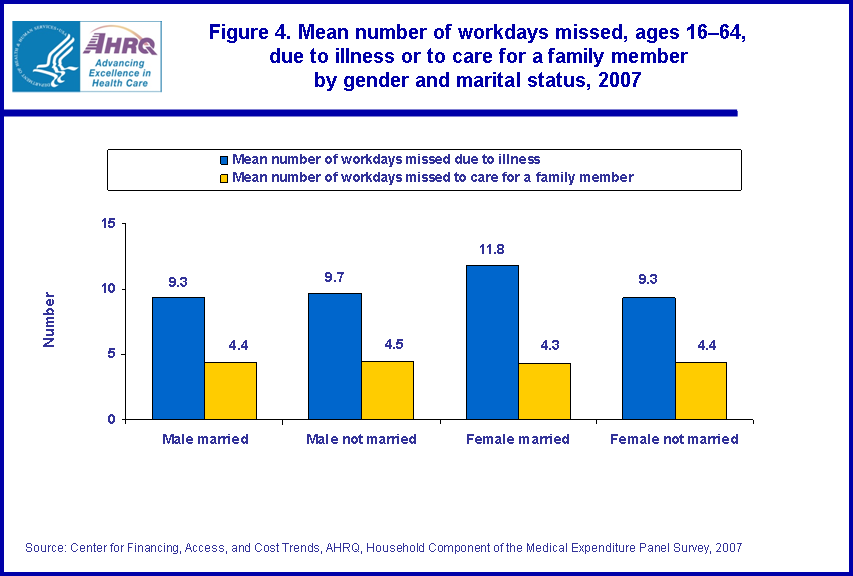
Females married (37.7 percent) and unmarried (38.3 percent) were more likely to have workdays lost due to illness, injury, or mental or emotional problems as compared to males, 30.8 and 29.2 percent for married and unmarried, respectively. Married individuals, both males and females, were more likely to miss workdays to care for family members with health problems (17.3 and 23.7 percent, respectively). However, among married individuals, females were the most likely to miss workdays to care for family members with health problems. Unmarried males were the least likely to miss workdays, 7.1 percent, to care for family members with health problems (figure 3). For those experiencing workdays lost there was no difference in the annual mean number of days lost amongst the four gender marital status groups, ranging from 11.8 days annually for married females to 9.3 days annually for both married males and unmarried females. The same was true for mean number of annual workdays lost to care for a family member with health problems, with all four groups averaging a little over four days annually (figure 4).
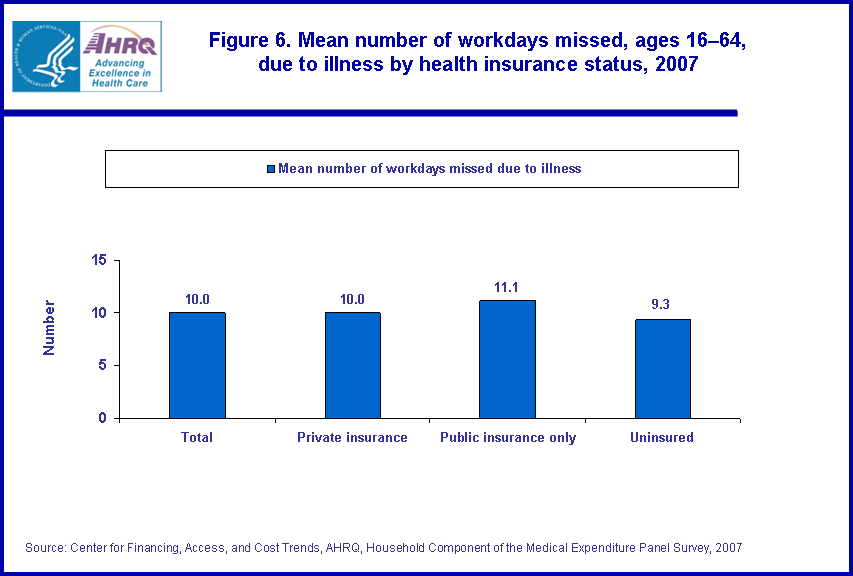
Individuals with private health insurance were the most likely to experience workdays lost (36.5 percent) due to illness, injury, or mental or emotional problems. In contrast, those reporting being uninsured were the least likely to have loss of workdays (26.2 percent). For those with public health insurance only, 31.8 percent reported workdays lost during the year (figure 5). For those experiencing workdays lost there was no difference in the annual mean number of days lost amongst the three groups, 10.0, 11.1, and 9.3 workdays lost annually for those with private health insurance, public health insurance, and uninsured, respectively (figure 6).
School days lost
Poverty level status
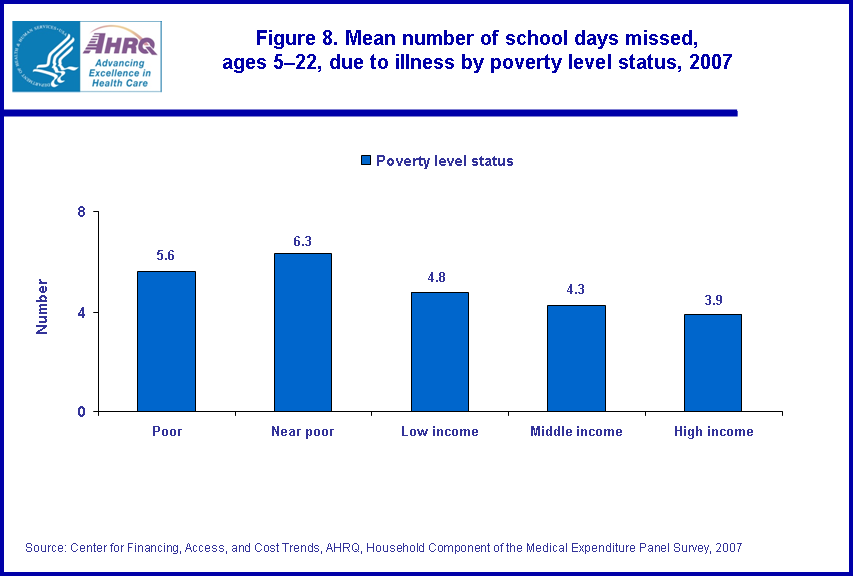
In 2007, children and young adults belonging to households reporting high or middle income were more likely to report missing school days due to illness, injury, or mental or emotional problems, 47.4 and 47.8 percent, respectively, compared to other income levels. For poor, near poor, and low income levels, the estimates for the percentage experiencing school days lost due to illness, injury, or mental or emotional problems were 39.1, 37.4, and 38.5 percent, respectively (figure 7). Individuals belonging to households reporting a high income level were more likely to experience school days lost due to illness, injury, or mental or emotional problems. However, when they did, the duration of mean annual days lost was less as compared to individuals in households reporting lower income levels (poor, near poor, and low income). For those belonging to households reporting a high income level their mean number of school days lost (3.9 days annually) was less than those reported in the poor (5.6 days annually), near poor (6.3 days annually), and low income (4.8 days annually) level households (figure 8).
Data Source
The estimates shown in this Statistical Brief are drawn from analyses conducted by the MEPS staff from the following public use file: MEPS HC-113: 2007 Full Year Consolidated Data File.Definitions
Restricted-activity daysThe variables on time lost from work represent whether individuals ages 16-64 lost a half-day or more from work because of illness, injury, or mental or emotional problems during the year and how many workdays were lost. Another set of variables indicates whether an individual took a half-day or more off from work to care for a family member with health problems and how many workdays were lost. The total number of workdays lost was accumulated for the year.
The variables on time lost from school represent whether individuals missed a half-day or more of school because of illness, injury, or mental or emotional problems during the year and how many school days were lost. There was no attempt to reconcile school days lost with the time of year (e.g., summer vacation).
Population characteristics
Age
Age was defined as age at the end of 2007.
Marital status
Marital status was constructed from information available at three points in time during the reference year, the interview dates for the first two rounds of the reference year and at the end of the year.
Health insurance coverage
The household respondent was asked if, during the reference period, anyone in the family was covered by any of the sources of private and public health insurance discussed below. Persons classified as uninsured for this report were uninsured throughout the reference year.
Private insurance: Private health insurance was defined as insurance that provides coverage for hospital and physician care (including Medigap coverage). Private health insurance could have been obtained through an employer, union, self-employed business, directly from an insurance company or health maintenance organization, through a group or association, or from someone outside the household.
Public insurance only: People were considered to have only public insurance if they met both of the following criteria:
- They were not covered by private insurance during the reference year.
- They were covered by one of the following: Medicare, CHAMPUS/CHAMPVA/TRICARE, Medicaid or State Children's Health Insurance Program (SCHIP), or other public hospital/physician coverage.
Poverty status
Sample persons were classified according to the total yearly income of their family. Within a household, all people related by blood, marriage, or adoption were considered to be a family. Poverty status categories are defined by the ratio of family income to the federal income thresholds, which control for family size and age of the head of family. Poverty status was based on annual income in 2007.
Poverty status categories are defined as follows:
- Poor: Persons in families with income less than or equal to the poverty line, including those who had negative income.
- Near poor: Persons in families with income over the poverty line through 125 percent of the poverty line.
- Low income: Persons in families with income over 125 percent through 200 percent of the poverty line.
- Middle income: Persons in families with income over 200 percent through 400 percent of the poverty line.
- High income: Persons in families with income over 400 percent of the poverty line.
About MEPS-HC
MEPS-HC is a nationally representative longitudinal survey that collects detailed information on health care utilization and expenditures, health insurance, and health status, as well as a wide variety of social, demographic, and economic characteristics for the U.S. civilian noninstitutionalized population. It is cosponsored by the Agency for Healthcare Research and Quality and the National Center for Health Statistics.For more information about MEPS, call the MEPS information coordinator at AHRQ (301) 427-1406 or visit the MEPS Web site at http://www.meps.ahrq.gov/.
References
For a detailed description of the MEPS-HC survey design, sample design, and methods used to minimize sources of nonsampling error, see the following publications:Cohen, J. Design and Methods of the Medical Expenditure Panel Survey Household Component. MEPS Methodology Report No. 1. AHCPR Pub. No. 97-0026. Rockville, MD: Agency for Health Care Policy and Research, 1997. http://www.meps.ahrq.gov/mepsweb/data_files/publications/mr1/mr1.shtml
Cohen, S. Sample Design of the 1996 Medical Expenditure Panel Survey Household Component. MEPS Methodology Report No. 2. AHCPR Pub. No. 97-0027. Rockville, MD: Agency for Health Care Policy and Research, 1997. http://www.meps.ahrq.gov/mepsweb/data_files/publications/mr2/mr2.shtml
Cohen, S. Design Strategies and Innovations in the Medical Expenditure Panel Survey. Medical Care, July 2003: 41(7) Supplement: III-5-III-12.
Ezzati-Rice, T.M., Rohde, F., Greenblatt, J., Sample Design of the Medical Expenditure Panel Survey Household Component, 1998-2007. Methodology Report No. 22. March 2008. Agency for Healthcare Research and Quality, Rockville, MD. http://www.meps.ahrq.gov/mepsweb/data_files/publications/mr22/mr22.shtml
Suggested Citation
Rhoades, J.A. Restricted-Activity Days, 2007: Estimates for the U.S. Civilian Noninstitutionalized Population, Ages 16-64. Statistical Brief #300. November 2010. Agency for Healthcare Research and Quality, Rockville, MD. http://www.meps.ahrq.gov/mepsweb/data_files/publications/st300/stat300.shtmlAHRQ welcomes questions and comments from readers of this publication who are interested in obtaining more information about access, cost, use, financing, and quality of health care in the United States. We also invite you to tell us how you are using this Statistical Brief and other MEPS data and tools and to share suggestions on how MEPS products might be enhanced to further meet your needs. Please e-mail us at mepspd@ahrq.gov or send a letter to the address below:
Steven B. Cohen, PhD, Director
Center for Financing, Access, and Cost Trends
Agency for Healthcare Research and Quality
540 Gaither Road
Rockville, MD 20850
 |
|||||||||||||||||||||||||
|
|||||||||||||||||||||||||
|
|
|||||||||||||||||||||||||
 |
|||||||||||||||||||||||||
|
|||||||||||||||||||||||||
|
|
|||||||||||||||||||||||||
 |
|||||||||||||||||||||||||
|
|||||||||||||||||||||||||
|
|
|||||||||||||||||||||||||
 |
|||||||||||||||||||||||||
|
|||||||||||||||||||||||||
|
|
|||||||||||||||||||||||||
 |
|||||||||||||||||||||||||
|
|||||||||||||||||||||||||
|
|
|||||||||||||||||||||||||
 |
|||||||||||||||||||||||||
|
|||||||||||||||||||||||||
|
|
|||||||||||||||||||||||||
 |
|||||||||||||||||||||||||
|
|||||||||||||||||||||||||
|
|
|||||||||||||||||||||||||
 |
|||||||||||||||||||||||||
|
|||||||||||||||||||||||||
|
|
|||||||||||||||||||||||||