
|
|
|
Font Size:
|
||||
|
|
|
|
||||
STATISTICAL BRIEF #304:
Trends in Use and Expenditures for Diabetes among Adults 18 and Older, U.S. Civilian Noninstitutionalized Population, 1996 and 2007
Highlights
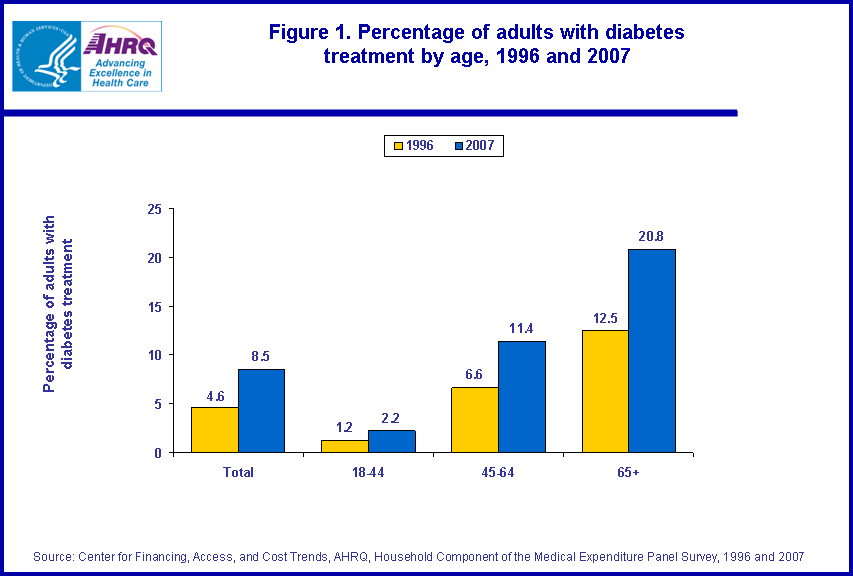
- In 2007, approximately 19 million adults or 8.5 percent of the adult U.S. population reported receiving treatment for diabetes. This represented a doubling of the number of people receiving treatment compared with 1996, when 9.1 million adults reported receiving treatment for diabetes.
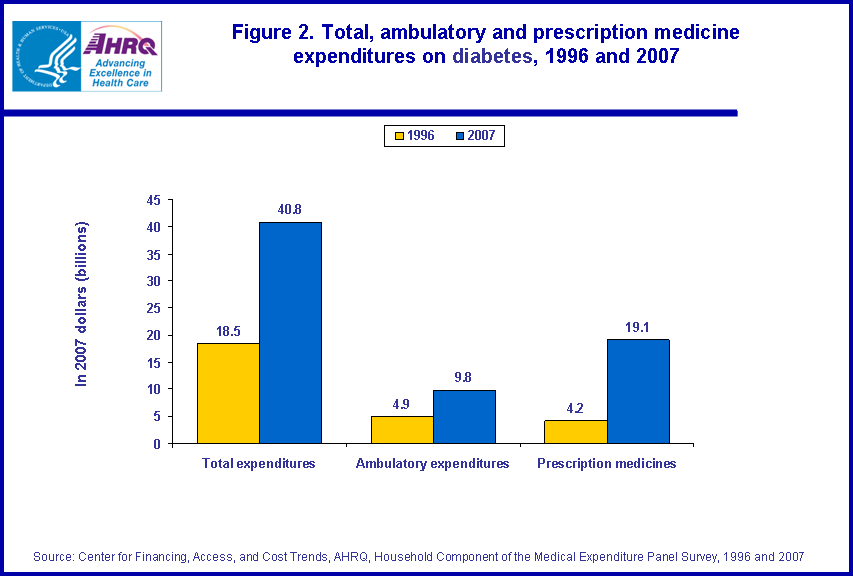
- Medical spending to treat diabetes increased from $18.5 billion in 1996 (in 2007 dollars) to $40.8 billion in 2007.
- Ambulatory expenditures for care and treatment of diabetes doubled from $4.9 billion in 1996 to $9.8 billion in 2007.
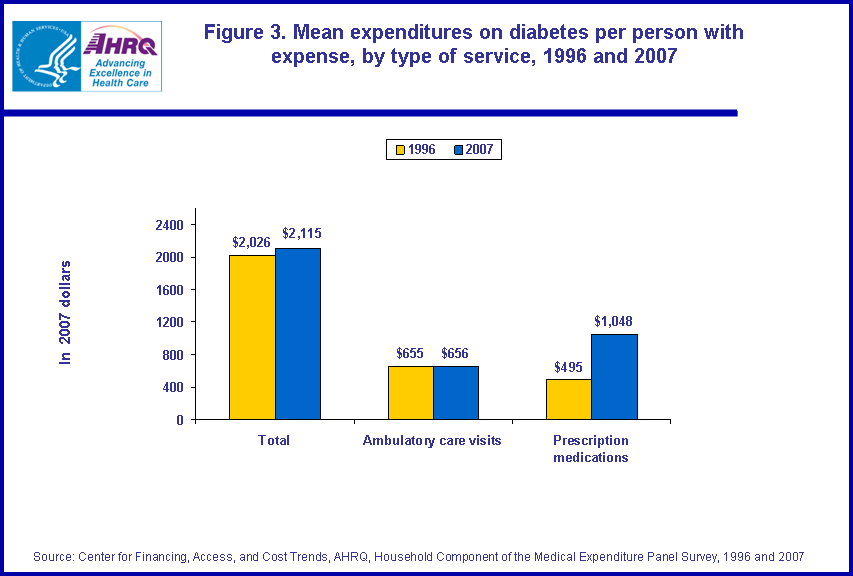
- Mean annual prescription drug expenditures for those with an expense related to diabetes more than doubled, from $495 per person in 1996 (in 2007 dollars) to $1,048 per person in 2007.
Introduction
Diabetes is a disease characterized by high levels of blood glucose (sugar). Diabetes results when the body does not produce enough insulin, when it is resistant to the insulin produced, or both. Diabetes can be treated by lifestyle modifications (diet, exercise), by using insulin and/or by using other prescribed medications. Untreated, diabetes is associated with a number of medical complications. According to American Diabetes Association, the number of individuals with diabetes continues to grow.This Statistical Brief presents estimates, based on the Household Component of the Medical Expenditure Panel Survey (MEPS-HC), of use and expenditures for ambulatory care and prescribed medications to treat diabetes among the U.S. adult civilian noninstitutionalized population. Average annual estimates for the years 1996 and 2007 are shown by type of service and source of payment. Expenditures are expressed in 2007 dollars. All differences between estimates noted in the text are statistically significant at the 0.05 level or better.
Findings
Number of adults treated for diabetes, by ageIn 2007, 8.5 percent of the U.S. adult population visited a physician or a health facility or obtained a prescription drug to treat diabetes. In 1996, the same was true for 4.6 percent of the population (figure 1). In both 1996 and 2007, those ages 65 and above received treatment for diabetes at higher rates than their younger age counterparts, those ages 18-44 and 45-64 (12.5 percent versus 1.2 percent and 6.6 percent in 1996 and 20.8 percent versus 2.2 percent and 11.4 percent in 2007).
A total of $40.8 billion was spent on treatment for diabetes in 2007, compared to $18.5 billion in 1996 (in 2007 dollars) (figure 2). Ambulatory expenditures on diabetes doubled from $4.9 billion in 1996 to $9.8 billion in 2007. Prescription medicine expenditures on diabetes increased almost four fold between these years, from $4.2 billion in 1996 to $19.1 billion in 2007. Among persons with any expense for diabetes, the average expenditures per person for prescription medicines doubled between 1996 and 2007, from $495 per person to $1,048 per person (figure 3).
Distribution of annual health care expenditures for diabetes, by source of payment and type of service
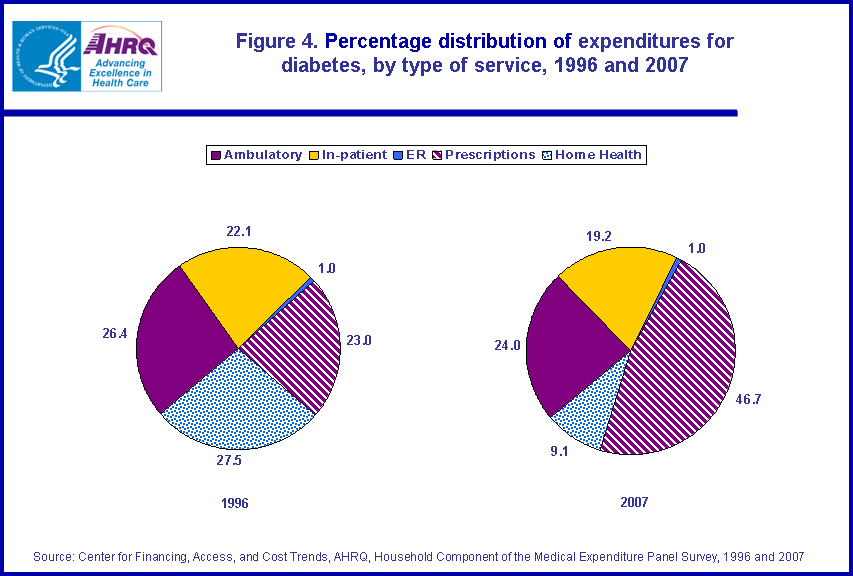
In 2007, 46.7 percent of the total diabetes expenditures were spent on prescription medicines compared to 23 percent in 1996 (figure 4). Out-of-pocket costs were highest for prescription medications in both years. Forty-three percent of prescription medicine expenditures were paid out-of-pocket in 1996 compared to 26.9 percent in 1996 (data not shown).
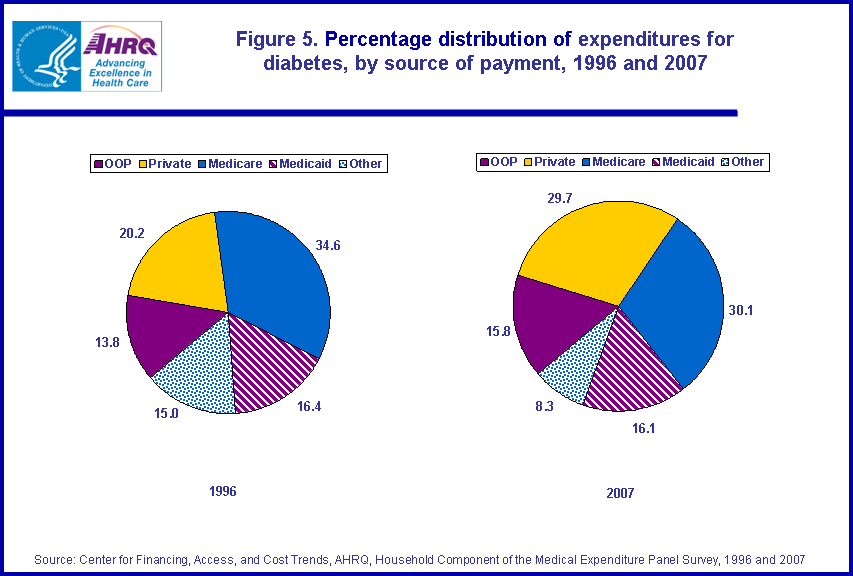
About 30 percent of total expenditures for the treatment of diabetes in 2007 were paid by private insurance as compared to 20.2 percent in 1996 (figure 5).
Data Source
The estimates shown in this Statistical Brief are based on data from the MEPS 1996 and 2007 Full Year Consolidated Files (HC-012 and HC-113), Medical Conditions Files (HC-006R and HC-112), Office-Based Medical Provider Visit Files (HC-010G and HC-110G), Outpatient Visits Files (HC-010F and HC-110F), Hospital Inpatient Stays Files (HC-010D and HC-110D), Home Health Files (HC-010H and HC-110H), Emergency Room Visits Files (HC-010E and HC-110E), and Prescribed Medicine Files (HC-010A and HC-110A).Definitions
DiabetesThis Brief analyzes individuals with diabetes reported as a condition bothering the person and diabetes reported in connection with reported health care utilization (e.g., a person who reported purchasing a drug was asked what condition the drug was intended to treat) or reported disability days. Conditions reported by respondents were recorded by interviewers as verbatim text, and were coded by professional coders to fully specified ICD-9-CM codes. Conditions with CCS codes of 49 and 50 were classified as diabetes for this brief. A crosswalk of ICD-9 codes and CCS codes is available in the documentation file of the Medical Conditions File for 2007 (HC-112). For additional information on crosswalk between ICD-9 codes and CCS codes, please visit: http://www.hcup-us.ahrq.gov/toolssoftware/ccs/ccs.jsp.
Expenditures
Expenditures in MEPS are defined as payments from all sources for hospital inpatient care, ambulatory care provided in offices and hospital outpatient departments, care provided in emergency departments, paid care provided in the patient's home (home health) and the purchase of prescribed medications. Sources include direct payments from individuals, private insurance, Medicare, Medicaid, Workers Compensation, and miscellaneous other sources. Expenditure data for 1996 were adjusted to 2007 dollars using the Consumer Price Index (CPI) and all estimates in this brief are reported in 2007 dollars. These expenditures do not include any 'over-the-counter' medications.
Sources of payment
- Private insurance: This category includes payments made by insurance plans covering hospital and other medical care (excluding payments from Medicare, Medicaid, and other public sources), Medigap plans, and TRICARE (Armed Forces-related coverage).
- Medicare: Medicare is a federally financed health insurance plan for the elderly, persons receiving Social Security disability payments, and persons with end-stage renal disease. Medicare Part A, which provides hospital insurance, is automatically given to those who are eligible for Social Security. Medicare Part B provides supplementary medical insurance that pays for medical expenses and can be purchased for a monthly premium. Medicare Part D, which started in 2006, covers prescription drug expenses.
- Medicaid/CHIP: This category includes payments made by the Medicaid and CHIP programs which are means-tested government programs financed jointly by Federal and state funds that provide health care to those who are eligible. Medicaid is designed to provide health coverage to families and individuals who are unable to afford necessary medical care while CHIP provides coverage to additional low income children not eligible for Medicaid. Eligibility criteria for both programs vary significantly by state.
- Out of pocket: This category includes expenses paid by the user or other family member.
- Other sources: This category includes payments from other Federal sources such as Indian Health Service, military treatment facilities, and other care provided by the Federal government; various state and local sources (community and neighborhood clinics, state and local health departments, and state programs other than Medicaid/CHIP); various unclassified sources (e.g., automobile, homeowner's, or other liability insurance, and other miscellaneous or unknown sources); Medicaid/CHIP payments reported for persons who were not reported as enrolled in the Medicaid or CHIP programs at any time during the year; and private insurance payments reported for persons without any reported private health insurance coverage during the year.
About MEPS-HC
MEPS-HC is a nationally representative longitudinal survey that collects detailed information on health care utilization and expenditures, health insurance, and health status, as well as a wide variety of social, demographic, and economic characteristics for the U.S. civilian noninstitutionalized population. It is cosponsored by the Agency for Healthcare Research and Quality and the National Center for Health Statistics.For more information about MEPS, call the MEPS information coordinator at AHRQ (301) 427-1656 or visit the MEPS Web site at http://www.meps.ahrq.gov/.
References
For a detailed description of the MEPS-HC survey design, sample design, and methods used to minimize sources of nonsampling errors, see the following publications:Cohen, J. Design and Methods of the Medical Expenditure Panel Survey Household Component. MEPS Methodology Report No. 1. AHCPR Pub. No. 97-0026. Rockville, MD. Agency for Health Care Policy and Research, 1997. http://www.meps.ahrq.gov/mepsweb/data_files/publications/mr1/mr1.shtml
Cohen, S. Sample Design of the 1996 Medical Expenditure Panel Survey Household Component. MEPS Methodology Report No. 2. AHCPR Pub. No. 97-0027. Rockville, MD. Agency for Health Care Policy and Research, 1997. http://www.meps.ahrq.gov/mepsweb/data_files/publications/mr2/mr2.shtml
Cohen, S. Design Strategies and Innovations in the Medical Expenditure Panel Survey. Medical Care, July 2003: 41(7) Supplement: III-5-III-12.
Ezzati-Rice, T.M., Rohde, F., Greenblatt, J. Sample Design of the Medical Expenditure Panel Survey Household Component, 1998-2007. Methodology Report No. 22. March 2008. Agency for Healthcare Research and Quality, Rockville, MD. http://www.meps.ahrq.gov/mepsweb/data_files/publications/mr22/mr22.shtml
For more information about diabetes, see the following publications:
Diabetes Basics: http://www.diabetes.org/
Diabetes Overview: http://diabetes.webmd.com/
About Diabetes: http://www.diabetes.com/
Diabetes: http://www.nlm.nih.gov/medlineplus/diabetes.html
Suggested Citation
Soni, A. Trends in Use and Expenditures for Diabetes among Adults 18 and Older, U.S. Civilian Noninstitutionalized Population, 1996 and 2007. Statistical Brief #304. December 2010. Agency for Healthcare Research and Quality. Rockville, MD. http://www.meps.ahrq.gov/mepsweb/data_files/publications/st304/stat304.shtmlAHRQ welcomes questions and comments from readers of this publication who are interested in obtaining more information about access, cost, use, financing, and quality of health care in the United States. We also invite you to tell us how you are using this Statistical Brief and other MEPS data and tools and to share suggestions on how MEPS products might be enhanced to further meet your needs. Please e-mail us at mepspd@ahrq.gov or send a letter to the address below:
Steven B. Cohen, PhD, Director
Center for Financing, Access, and Cost Trends
Agency for Healthcare Research and Quality
540 Gaither Road
Rockville, MD 20850
 |
||||||||||||||||||||||||||||||
|
||||||||||||||||||||||||||||||
|
|
||||||||||||||||||||||||||||||
 |
||||||||||||||||||||||||||||||
|
||||||||||||||||||||||||||||||
|
|
||||||||||||||||||||||||||||||
 |
||||||||||||||||||||||||||||||
|
||||||||||||||||||||||||||||||
|
|
||||||||||||||||||||||||||||||
 |
||||||||||||||||||||||||||||||
|
||||||||||||||||||||||||||||||
|
|
||||||||||||||||||||||||||||||
 |
||||||||||||||||||||||||||||||
|
||||||||||||||||||||||||||||||
|
|
||||||||||||||||||||||||||||||