
|
|
Font Size:
|
||||
|
|
|
|
||||
STATISTICAL BRIEF #81:
Concentration of Health Care Expenditures in the U.S. Civilian Noninstitutionalized Population
Highlights
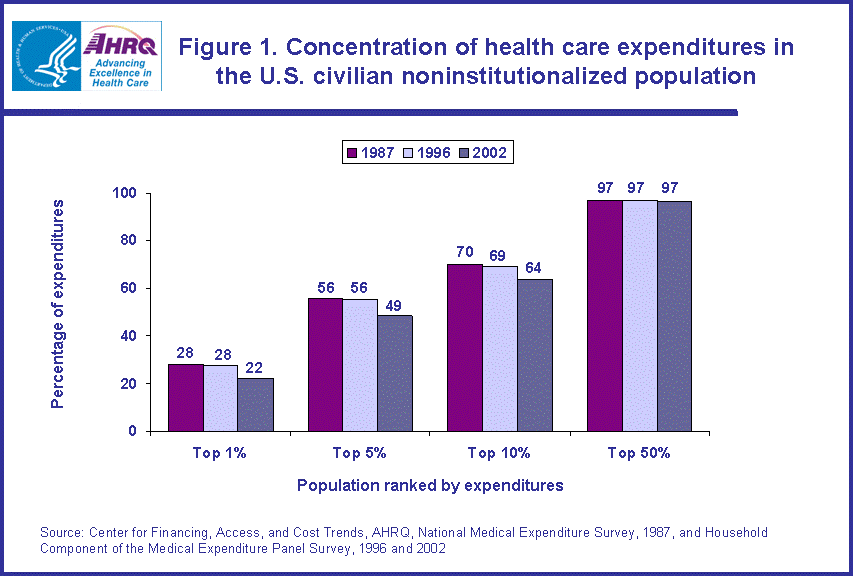
- In 1987, 1996, and 2002, the lower 50 percent of the population as ranked by expenditures accounted for only about 3 percent of total expenditures.
- Some attenuation in the magnitude at the upper tail of the expenditure distribution has occurred over time. In 1996, for example, the top 1 percent of the population accounted for 28 percent of total health care expenditures; by 2002, this figure had decreased to 22 percent.
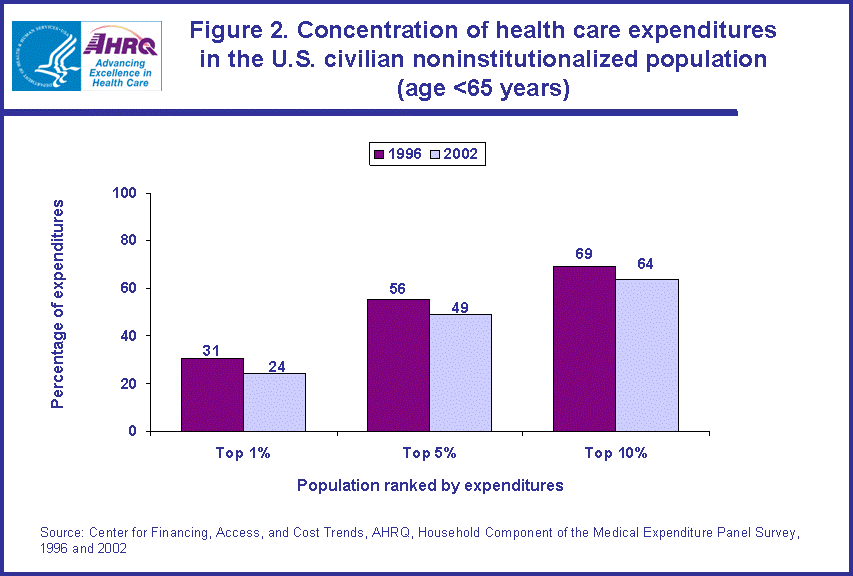
- The top 1 percent of the non-elderly population accounted for 24 percent of 2002 total non-elderly expenditures compared to 31 percent in 1996.
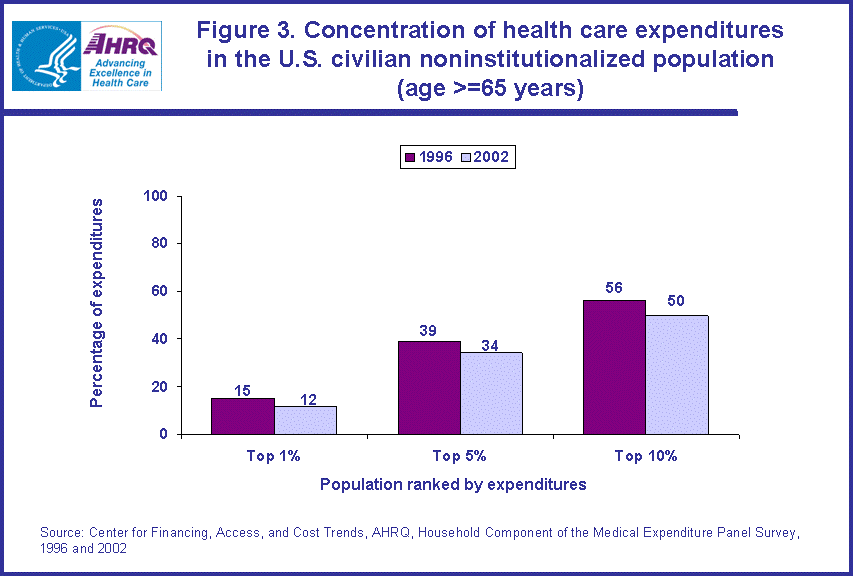
- The magnitude of the concentration of expenditures was less in the elderly than in the non-elderly (under 65) population. In 2002, the top 1 percent of the elderly accounted for 12 percent of total expenditures compared to 24 percent of the non-elderly.
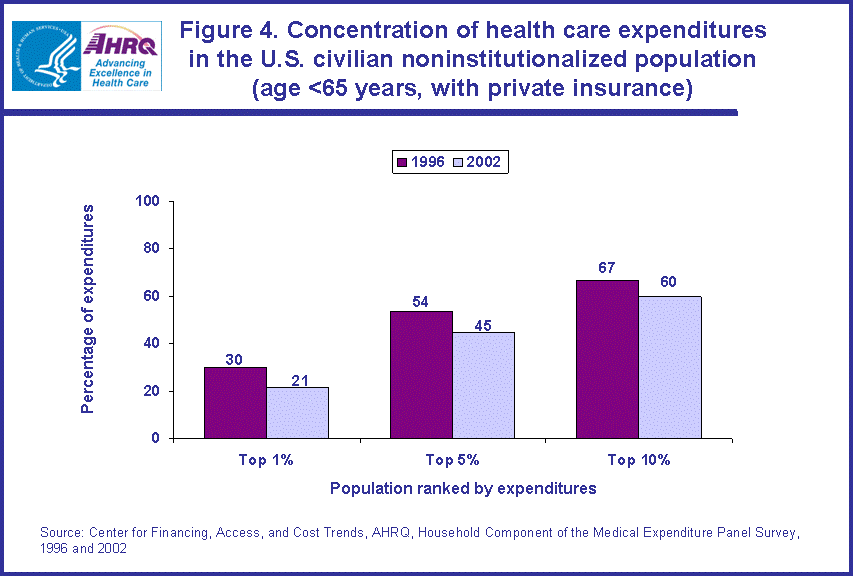
- Non-elderly persons with any private insurance also experienced a decreasing trend at the high expenditure tail of the expenditure distribution from 1996 to 2002.
- Between 1996 and 2002, the concentration of expenditures decreased for the top 5 and top 10 percent of the non-elderly in fair/poor health and for the top 10 percent of those in excellent/very good/good health.
Introduction
The Household Component of the Medical Expenditure Panel Survey (MEPS-HC) provides essential information for assessing trends in the concentration of health care expenditures in the U.S. civilian noninstitutionalized population. The MEPS-HC data indicate that health care spending is highly concentrated, with a relatively small proportion of the population accounting for a large share of total health care expenses; in 1996, for example, the top 1 percent of the U.S. population accounted for 28 percent of the total health care expenditures and the top 5 percent for over one-half (56 percent).* The data also show that over time there has been some decrease in the extent of this concentration at the upper tail of the expenditure distribution.
This Statistical Brief presents estimates from the MEPS-HC and the National Medical Expenditure Survey (NMES) on the concentration of health care expenditures for the years 1987, 1996, and 2002. All differences between estimates discussed in the text are statistically significant at the 0.05 level unless noted otherwise.
Findings
The majority of the U.S. civilian noninstitutionalized population accounts for a very small percentage of annual aggregate health care expenditures. Based on 1987, 1996, and 2002 data, the lower 50 percent of the population as ranked by expenditures consistently accounted for only about 3 percent of total expenditures. (figure 1)
Over the decade from 1987 to 1996, the concentration of high-end expenditures (upper tail of the expenditure distribution) was also relatively stable. From 1996 to 2002, however, some attenuation occurred at the upper tail of the distribution, with the share of expenditures by the top 1 percent of health care spenders decreasing from 28 to 22 percent. Also, for the top 5 and 10 percent of spenders, the extent of concentration decreased somewhat from 1996 to 2002, from 56 to 49 percent and 69 to 64 percent, respectively. (figure 1)
The attenuation in magnitude at the upper tail of the expenditure distribution over time for the entire civilian noninstitutionalized population was also observed for the non-elderly (under 65) population. In 2002, the concentration of expenditures for the top 1 percent of the non-elderly population was 24 percent compared to 31 percent in 1996. Similar decreases occurred among the top 5 and 10 percent of the non-elderly population. (figure 2)
The magnitude of the concentration of expenditures was much less visible in the elderly population compared to the non-elderly. In 2002, the concentration of expenditures for the top 1, 5, and 10 percent of the non-elderly population was 24, 49, and 64 percent (figure 2), respectively, as compared to 12, 34, and 50 percent, respectively, for the elderly. (figure 3)
For the non-elderly, the trend of decreasing concentration from 1996 to 2002 at the upper tail of the expenditure distribution was observed for persons with private insurance. In 2002, the top 1, 5, and 10 percent of the non-elderly with any private insurance population accounted for 21, 45, and 60 percent of the expenditures, respectively, as compared to 30, 54, and 67 percent, respectively, in 1996 (figure 4). This general decreasing trend was not observed for non-elderly persons uninsured or with public insurance coverage. (data not shown)
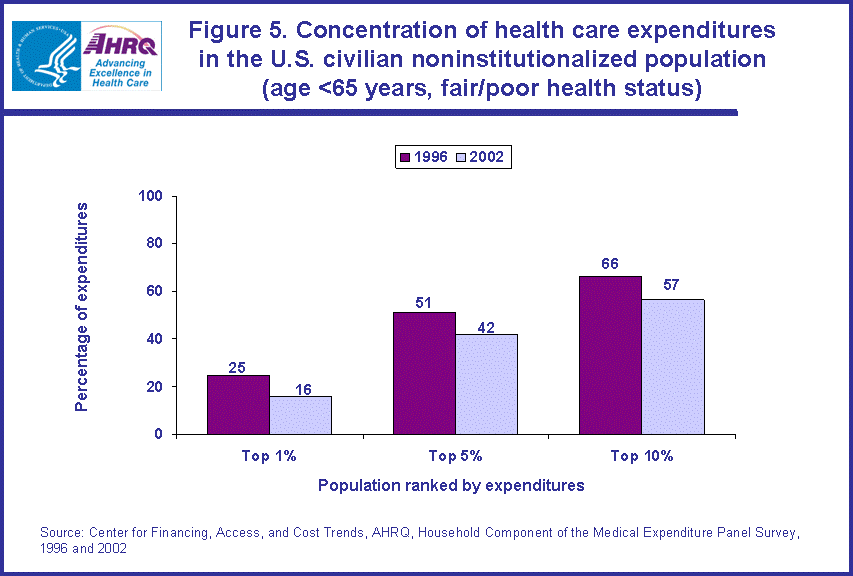
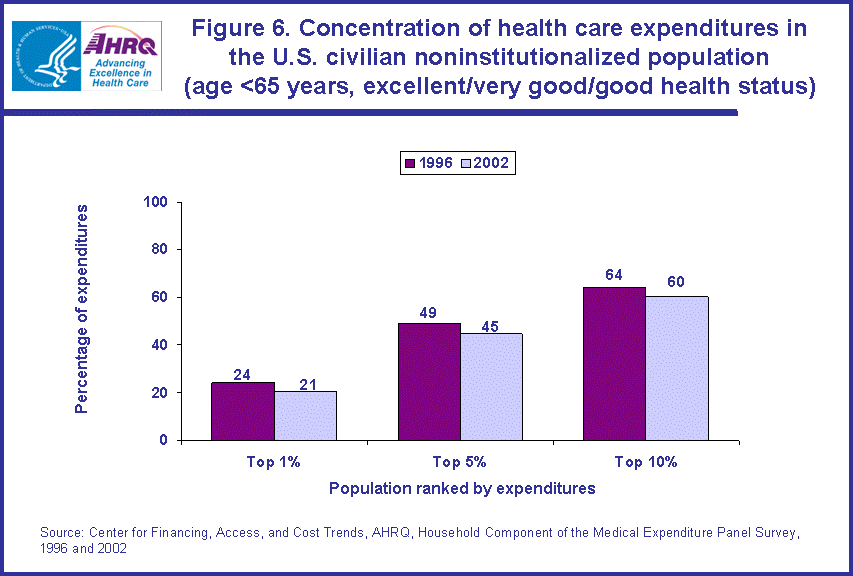
When self-reported health status is categorized into two groups, fair/poor and excellent/very good/good, the general decreasing trend in concentration was noted for the top 10 percent of the non-elderly. In 2002, the concentration of expenditures for the top 10 percent of the non-elderly in fair/poor health was 57 percent compared to 66 percent in 1996 (figure 5), while for the top 10 percent of the non-elderly in excellent/very good/good health, the 2002 and 1996 percentages were 60 percent and 64 percent, respectively, (figure 6). The top 5 percent of the non-elderly with excellent/very good/good health status also showed a significant decrease (45 percent in 2002 versus 49 percent in 1996).
Data Source
The 1996 and 2002 estimates in this Statistical Brief are based upon data from the MEPS-HC 1996 and 2002 Full Year Consolidated Data Files, HC-012 and HC-070. The 1987 estimates are based on the 1987 NMES.
Definitions
Expenditures
The 1987 NMES collected information on expenditures in terms of total charges while MEPS-HC measures this information in terms of total expense. NMES defined total charge as the amount charged for the medical service provided. MEPS-HC defines total expense as the sum of payments from all sources to hospitals, physicians, other health care providers (including dental care), and pharmacies for services reported by respondents in the MEPS-HC. Sources include direct payments from individuals and families, private insurance, Medicare, Medicaid, and miscellaneous other sources. No attempt was made to account for this change in measurement.
Health insurance status
- Any private coverage: Private health insurance coverage is defined as nonpublic insurance that provides coverage for hospital and physician care (including Medigap coverage). Persons covered by TRICARE (Armed Forces-related coverage) are also included in this category.
- Public only coverage: People are considered to have public only health insurance coverage if they are not covered by private insurance, and they are covered by Medicare, Medicaid, or other public hospital and physician coverage.
- Uninsured: People who did not have insurance coverage at any time during the survey year are classified as uninsured. People who are covered only by noncomprehensive, State-specific programs (e.g., Maryland Kidney Disease Program) or private single service plans (e.g., coverage for dental or vision care only, coverage for accidents or specific diseases) are considered to be uninsured.
About MEPS and NMES
The Medical Expenditure Panel Survey (MEPS) is the third in a series of nationally representative surveys of medical care use and expenditures. MEPS is cosponsored by the Agency for Healthcare Research and Quality (AHRQ) and the National Center for Health Statistics. MEPS collects nationally representative data on health care use, expenditures, sources of payment, and insurance coverage for the U.S. civilian noninstitutionalized population. The first survey, the National Medical Care Expenditure Survey (NMCES) was conducted in 1977; and the second survey, the National Medical Expenditure Survey (NMES), was carried out in 1987.
NMES and MEPS data are released to the public in public use data files. NMES data files are available from the AHRQ Publications Clearinghouse (E-mail: ahrqpubs@ahrq.gov). MEPS data files are available on the MEPS Web site.
For more information about MEPS, call the MEPS information coordinator at AHRQ (301-427-1656) or visit the MEPS Web site at http://www.meps.ahrq.gov/.
References
U.S. Department of Health and Human Services. Surgeon General's Report on Physical Activity and Health. Atlanta, Ga.: Centers for Disease Control and Prevention, National Center for Chronic Disease Prevention and Health Promotion, 1996.
For more information on what can be done to improve health, see AHRQ's The Pocket Guide to Good Health for Adults, which is available at http://www.ahrq.gov/ppip/adguide/.
For a detailed description of the MEPS-HC survey design, sample design, and methods used to minimize sources on nonsampling error, see the following publications:
Cohen, J. Design and Methods of the Medical Expenditure Panel Survey Household Component. MEPS Methodology Report No. 1. AHCPR Pub. No. 97-0026. Rockville, Md.: Agency for Health Care Policy and Research, 1997.
Cohen, S. Sample Design of the 1996 Medical Expenditure Panel Survey Household Component. MEPS Methodology Report No. 2. AHCPR Pub. No. 97-0027. Rockville, Md.: Agency for Health Care Policy and Research, 1997.
Cohen, S. Design Strategies and Innovations in the Medical Expenditure Panel Survey. Medical Care, July 2003: 41(7) Supplement: III-5-III-12.
For more information on the NMES survey design, see the following publications:
Cohen, S., R. DiGaetano, and J. Waksberg. Sample design of the 1987 Household Survey. AHCPR Pub. No. 91-0037. National Medical Expenditure Survey Methods 3. Agency for Healthcare Policy and Research. Rockville, Md.: U.S. Department of Health and Human Services, Public Health Service, 1991.
Edwards, W. and M. Berlin. Questionnaires and data collection methods for the household survey and the survey of American Indians and Alaskan Natives. DHHS Pub. No. (PHS) 89-3450. National Medical Expenditure Survey Methods 2. National Center for Health Services Research and Health Care Technology Assessment. Rockville, Md.: U.S. Department of Health and Human Services, Public Health Service, 1989.
Suggested Citation
Yu, W. W. and Ezzati-Rice, T. M. Concentration of Health Care Expenditures in the U.S. Civilian Noninstitutionalized Population. Statistical Brief #81. May 2005. Agency for Healthcare Research and Quality, Rockville, Md. http://www.meps.ahrq.gov/mepsweb/data_files/publications/st81/stat81.shtml
Footnote
* Monheit, A. Persistence in Health Expenditures in the Short Run: Prevalence and Consequences. Medical Care, July 2003: 41(7) Supplement: III-53-III-64.
 |
|||||||||||||||||||||||||||||||||||
|
|||||||||||||||||||||||||||||||||||
|
|
|||||||||||||||||||||||||||||||||||
 |
|||||||||||||||||||||||||||||||||||
|
|||||||||||||||||||||||||||||||||||
|
|
|||||||||||||||||||||||||||||||||||
 |
|||||||||||||||||||||||||||||||||||
|
|||||||||||||||||||||||||||||||||||
|
|
|||||||||||||||||||||||||||||||||||
 |
|||||||||||||||||||||||||||||||||||
|
|||||||||||||||||||||||||||||||||||
|
|
|||||||||||||||||||||||||||||||||||
 |
|||||||||||||||||||||||||||||||||||
|
|||||||||||||||||||||||||||||||||||
|
|
|||||||||||||||||||||||||||||||||||
 |
|||||||||||||||||||||||||||||||||||
|
|||||||||||||||||||||||||||||||||||
|
|
|||||||||||||||||||||||||||||||||||


