
|
|
Font Size:
|
||||
|
|
|
|
||||
STATISTICAL BRIEF #139:
Trends in the Use and Expenditures for COX-2 Inhibitors and Traditional Nonsteroidal Anti-inflammatory Drugs, 1997-2003
Highlights
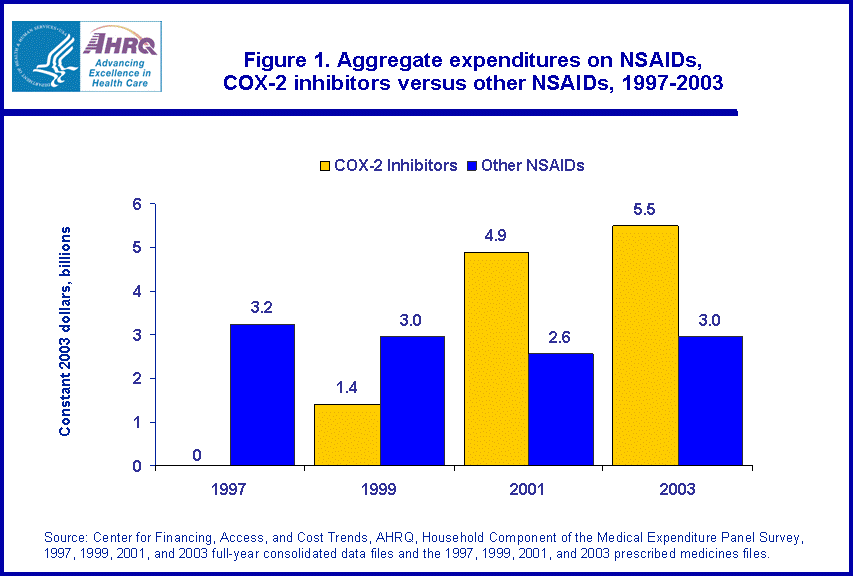
- Aggregate spending on COX-2 inhibitors climbed from zero in 1997, the year before their introduction, to $5.5 billion in 2003.
- Expenditures for COX-2 inhibitors accounted for 65.0 percent of total spending on all NSAIDs by 2003.
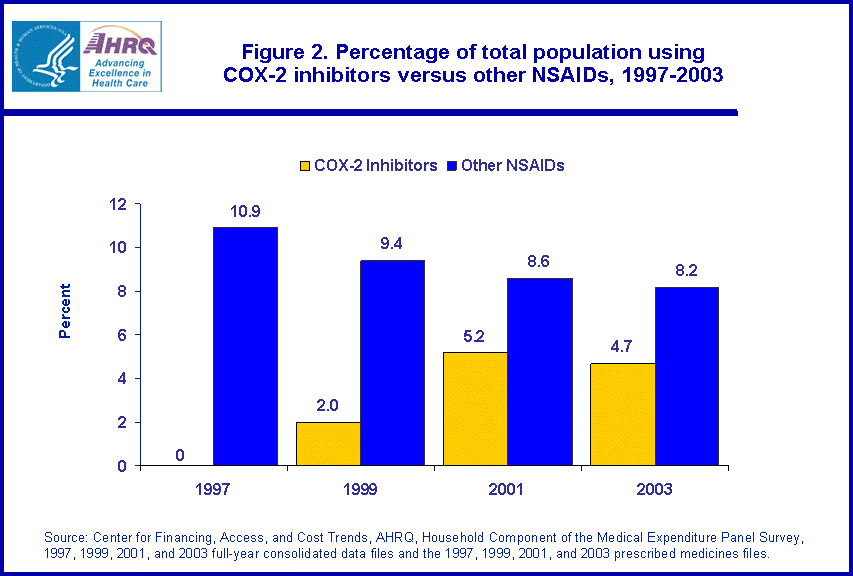
- The percentage of the total population using COX-2 inhibitors grew from zero percent in 1997 to 4.7 percent in 2003. Among Medicare beneficiaries, the percentage using COX-2 inhibitors increased to 12.5 percent by 2003.
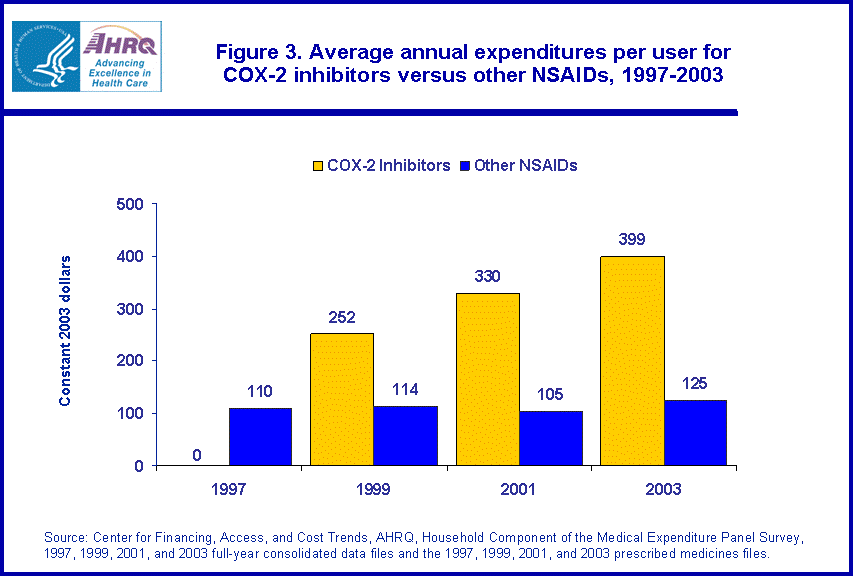
- In 2003, average spending per user of COX-2 inhibitors was about $399 per year while average spending per user of other NSAIDs was less than one-third this amount, at $125 per year.
Introduction
Since their approval by the Food and Drug Administration (FDA) in 1998, selective cyclooxygenase-2 inhibitors (COX-2 inhibitors) have accounted for a growing proportion of prescriptions for the class containing all nonsteroidal anti-inflammatory drugs (NSAIDs).1 COX-2 inhibitors include drugs such as celecoxib (Celebrex) and rofecoxib (Vioxx). Although rofecoxib was withdrawn from the market in late 2004 due to adverse side effects associated with coronary problems,2 celecoxib remains on the market and is widely prescribed. COX-2 inhibitors are reported to induce fewer adverse gastrointestinal side effects compared with other traditional NSAIDs such as ibuprofen and naproxen.3 As a class, NSAIDs are used to treat pain and are commonly prescribed for treatment of arthritis.4
This Statistical Brief uses data from the Household Component of the Medical Expenditure Panel Survey (MEPS-HC) to document trends in use and expenditures for COX-2 inhibitors from 1997 to 2003 in relation to trends for traditional NSAIDs. The analysis begins in 1997 in order to measure the level of spending and use of traditional NSAIDs before COX-2 inhibitors were introduced. The brief shows changes in the percentage of the population using COX-2 inhibitors versus traditional NSAIDs. All trends are presented for the total civilian noninstitutionalized population and then separately for the Medicare noninstitutionalized population, who are heavier users of the NSAID class of drugs. This analysis is limited to spending on prescribed medications since MEPS-HC excludes expenditures for over-the-counter medications. All differences discussed in the text are statistically significant at the 5 percent level, unless otherwise specified.
Findings
Aggregate spending on COX-2 inhibitors climbed from zero in 1997, before they were introduced, to $5.5 billion in 2003, while aggregate spending on traditional NSAIDs showed little change (figure 1). Spending on traditional NSAIDs did not change significantly, moving from a level of $3.2 billion in 1997 to $3.0 billion in 2003. When considered as a class, expenditures for COX-2 inhibitors accounted for 65.0 percent of total spending on all NSAIDs by 2003 (data not shown).
Changes in aggregate spending reflect shifts over time in the percentage of the population using the two types of NSAIDs. In 1997, about 10.9 percent of the noninstitutionalized population was prescribed at least one traditional NSAID (figure 2). This percentage fell slowly over time so that by 2003, about 8.2 percent of the population was prescribed at least one traditional NSAID. In the same period, the percentage of the population using COX-2 inhibitors bounced from zero percent in 1997 to 5.2 percent in 2001 and 4.7 percent in 2003. Among users of all types of NSAIDs, the percentage using a COX-2 inhibitor at least once during the year jumped from zero percent in 1997 to 39.9 percent in 2003 (data not shown).
Changes in aggregate spending on all types of NSAIDs also reflect higher average spending per user of COX-2 inhibitors versus traditional NSAIDs. In 2003, average spending per user of COX-2 inhibitors was about $399 per year (figure 3). In 2003, average spending per user of traditional NSAIDs was less than one-third this amount, at $125 per year. This difference reflects the higher prices of the newer COX-2 inhibitors versus the older NSAID drugs.
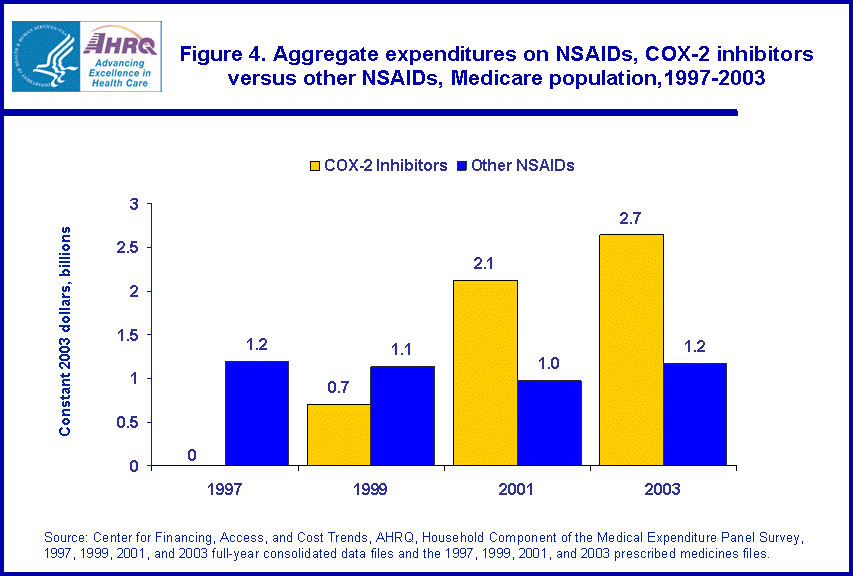
Compared with the total population, Medicare beneficiaries are heavier users of NSAIDs. Furthermore, aged beneficiaries are more likely than younger adults to exhibit the risk factors associated with adverse gastrointestinal side effects from traditional NSAIDs.5 Between 1997 and 2003, aggregate expenditures on COX-2 inhibitors by Medicare beneficiaries increased from zero to $2.7 billion (figure 4). Spending on other NSAIDs remained steady at $1.2 billion in 1997 and $1.2 billion in 2003. Just as with the entire population, COX-2 inhibitors accounted for 65 percent of total expenditures on the entire class of NSAID medicines (data not shown).
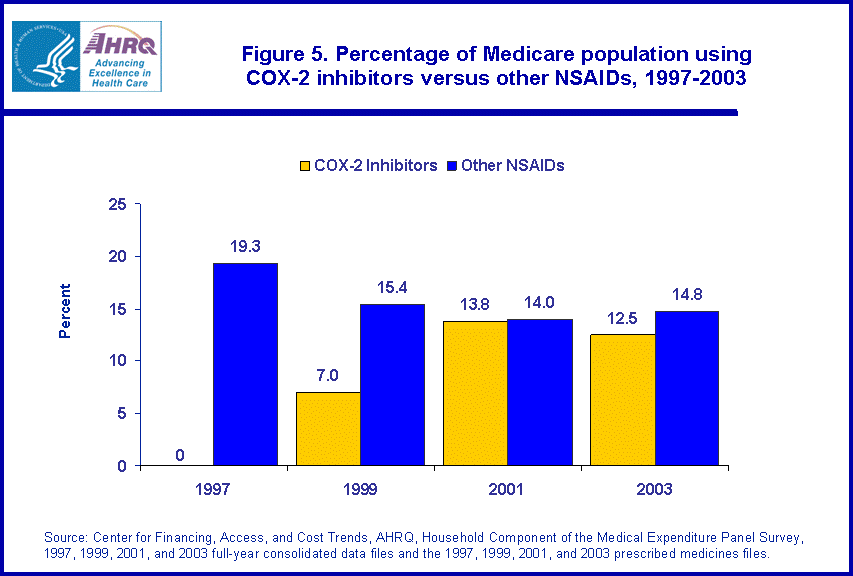
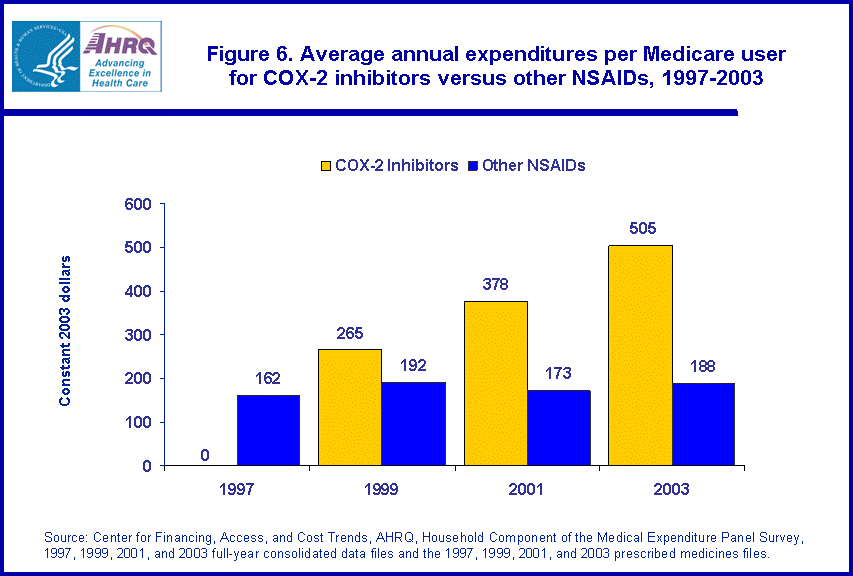
About 19.3 percent of Medicare beneficiaries purchased at least one traditional NSAID in 1997 (figure 5), nearly double the purchase rate among the total population. By 2003, this rate had dropped to 14.8 percent. During the same period, use of COX-2 inhibitors increased from zero percent of the Medicare population in 1997 to 12.5 percent in 2003. Among all users of NSAIDs in the Medicare population, more than half (50.2 percent) used at least one COX-2 inhibitor during the year (data not shown). In 2003, the average annual expenditure per beneficiary for COX-2 inhibitors was $505 compared with $188 for other NSAIDs (figure 6).
Data Source
The estimates presented in this Statistical Brief were derived from the MEPS-HC 1997, 1999, 2001, and 2003 full-year consolidated data files and the 1997, 1999, 2001, and 2003 prescribed medicines (PMED) files. Expenditures for COX-2 inhibitors and traditional NSAIDs were identified by linking the PMED files to the Multum Lexicon.
Definitions
Persons are defined as Medicare beneficiaries if they ever reported being enrolled in Medicare while in the survey. For analytic purposes, this classification also includes a very small number of persons aged 65 and over who did not report Medicare coverage.
About MEPS-HC
MEPS-HC is a nationally representative longitudinal survey that collects detailed information on health care utilization and expenditures, health insurance, and health status, as well as a wide variety of social, demographic, and economic characteristics for the civilian noninstitutionalized population. It is cosponsored by the Agency for Healthcare Research and Quality and the National Center for Health Statistics.
For more information about MEPS, call the MEPS information coordinator at AHRQ (301-427-1656) or visit the MEPS Web site at http://www.meps.ahrq.gov/.
References
For a detailed description of the MEPS survey design, sample design, and methods used to minimize sources of nonsampling error, see the following publications:
Cohen, J. Design and Methods of the Medical Expenditure Panel Survey Household Component. MEPS Methodology Report No. 1. AHCPR Pub. No. 97-0026. Rockville, Md.: Agency for Health Care Policy and Research, 1997.
Cohen, S. Sample Design of the 1996 Medical Expenditure Panel Survey Household Component. MEPS Methodology Report No. 2. AHCPR Pub. No. 97-0027. Rockville, Md.: Agency for Health Care Policy and Research, 1997.
Cohen, S. Design Strategies and Innovations in the Medical Expenditure Panel Survey. Medical Care, July 2003: 41(7) Supplement: III-5-III-12.
Suggested Citation
Banthin, J. S. and Zodet, M. Trends in the Use and Expenditures for COX-2 Inhibitors and Traditional Nonsteroidal Anti-inflammatory Drugs, 1997-2003. Statistical Brief #139. September 2006. Agency for Healthcare Research and Quality, Rockville, Md. http://www.meps.ahrq.gov/mepsweb/data_files/publications/st139/stat139.shtml
AHRQ welcomes questions and comments from readers of this publication who are interested in obtaining more information about access, cost, use, financing, and quality of health care in the United States. We also invite you to tell us how you are using this Statistical Brief and other MEPS data and tools and to share suggestions on how MEPS products might be enhanced to further meet your needs. Please e-mail us at mepspd@ahrq.gov or send a letter to the address below:
Steven B. Cohen, PhD, Director
Center for Financing, Access, and Cost Trends
Agency for Healthcare Research and Quality
540 Gaither Road
Rockville, MD 20850
Footnotes
1 Dai, C., Stafford, R., Alexander, C. 2005. National Trends in Cyclooxygenase-2 Inhibitor Use Since Market Release, Archives of Internal Medicine January 24, 2005,165(2):171-177.
2 Graham, D., Campen, D., Hui, R., et al. Risk of acute myocardial infarction and sudden cardiac death in patients treated with cyclooxygenase 2 selective and non-selective non-steroidal anti-inflammatory drugs: nested case-control study. The Lancet, Volume 365, Issue 9458, Pages 475-481.
3 Deeks, J. J., Smith, L. A., Bradley, M. D.. 2002. Efficacy, tolerability, and upper gastrointestinal safety of celecoxib for treatment of osteoarthritis and rheumatoid arthritis: systematic review of randomized controlled trials. BMJ 2002 Sep 21;325(7365):619.
4 Silverstein, F. E., Faich, G., Goldstein, J. L., et al. 2000. Gastrointestinal toxicity with celecoxib vs nonsteroidal anti-inflammatory drugs for osteoarthritis and rheumatoid arthritis: the CLASS study: A randomized controlled trial. Celecoxib Long-term Arthritis Safety Study. JAMA 2000 Sep 13; 284(10):1247-55.
5 Go, M. F. Drug injury in the upper gastrointestinal tract: nonsteroidal anti-inflammatory drugs. Gastrointest, Endocs, Clini N Am 2006 Jan;16(1):83-97.
 |
||||||||||||||||||||||||||||||
|
||||||||||||||||||||||||||||||
|
|
||||||||||||||||||||||||||||||
 |
||||||||||||||||||||||||||||||
|
||||||||||||||||||||||||||||||
|
|
||||||||||||||||||||||||||||||
 |
||||||||||||||||||||||||||||||
|
||||||||||||||||||||||||||||||
|
|
||||||||||||||||||||||||||||||
 |
||||||||||||||||||||||||||||||
|
||||||||||||||||||||||||||||||
|
|
||||||||||||||||||||||||||||||
 |
||||||||||||||||||||||||||||||
|
||||||||||||||||||||||||||||||
|
|
||||||||||||||||||||||||||||||
 |
||||||||||||||||||||||||||||||
|
||||||||||||||||||||||||||||||
|
|
||||||||||||||||||||||||||||||


