|
|
Font Size:
|
||||
|
|
|
|
||||
STATISTICAL BRIEF #367:
Indicators of Health Care Quality by Income and Insurance Status among Individuals with a Usual Source of Care, 2009
Highlights
- Individuals living below 200 percent of the federal poverty line (FPL) are more likely to report that their USC provider never or sometimes shows respect for their treatment preferences, and never or sometimes asks them to help decide on treatment options.
- Compared to individuals with any private coverage, those with public-only coverage and the uninsured are more likely to report that their USC provider never or sometimes shows respect for their treatment preferences, and never or sometimes asks them to help decide on treatment options.
- Compared to individuals in the highest income group (over 400 percent of FPL), individuals living below 125 percent FPL are less likely to report that their USC provider explains treatment options in a way they can understand and are less likely to report that their USC provider asks about treatments other doctors give them.
- Compared to individuals with any private insurance, those with full year public coverage are less likely to report that their USC providers explain treatment options in a way they can understand.
Introduction
Having a usual source of medical care (USC) is used frequently as an indicator of access to ambulatory care. Among those with a USC provider, however, the quality of care may vary substantially. Respect for patients’ preferences, soliciting patients’ opinions and clearly explaining treatment options are key to achieving high quality, “patient centered” medical care.1 In this Brief, we investigate several indicators of quality pertaining to “patient centeredness” among those with a USC provider and how they differ by household income and insurance status. We use responses from four questions on the Household Component of the Medical Expenditure Panel Survey (MEPS) pertaining to individuals’ perceptions of and experiences with their USC provider:- Thinking about the types of medical, traditional, and alternative treatments that you are happy with, how often does your providers how respect for these treatments (“always” or “usually” versus “sometimes” or “never”)?
- If there were a choice between treatments, how often would your provider ask you to help make the decision (“always” or “usually” versus “sometimes” or “never”)?
- Does your provider present and explain all options to you (yes or no)?
- Does your provider usually ask about prescription medications and treatments other doctors may give you (yes or no)?
Findings
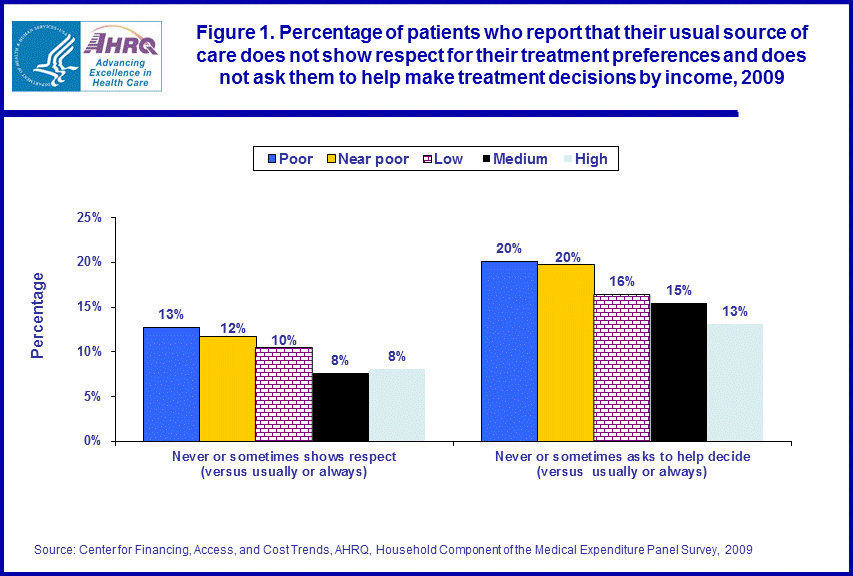
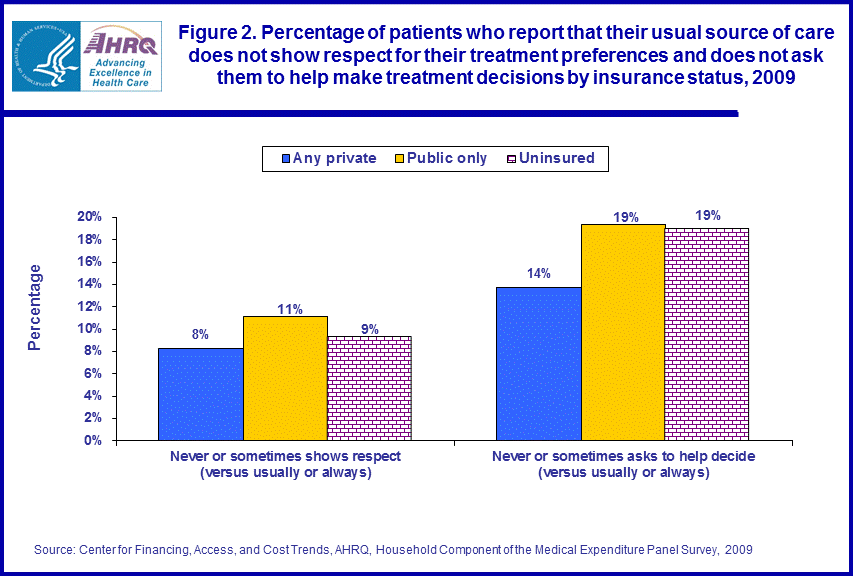
Results indicate that, among those with a USC provider, quality of care and patient centeredness varies substantially by household income and insurance status. Only 8 percent of individuals in the medium and high income categories report that their USC provider never or sometimes shows respect for their treatment preferences, while 13 percent of those in the poorest income group do (figure 1). The corresponding percentages for individuals in the near poor and low income groups are 12 percent and 10 percent, respectively. This quality indicator also varies by insurance status; compared to individuals with private insurance coverage, a higher proportion of those with public-only health insurance coverage report that their USC provider never or sometimes shows respect for their treatment preferences (11 percent versus 8 percent in figure 2).The percentage of individuals who report that their USC provider never or sometimes asks them to help decide on treatment options also varies by income and insurance status. Compared to individuals in the highest income group (over 400 percent FPL), individuals in all the other income groups more frequently report that their USC provider never or sometimes asks them to help decide on treatment options. For example, 13 percent of individuals in the highest income group report their USC providers never or sometimes ask them to help decide on treatment options, while 20 percent of individuals in the poorest income group do. Significant differences on this indicator emerge by insurance coverage too; among those with public-only coverage or with no coverage, 19 percent report that their USC provider never or sometimes asks them to help decide on treatment options, compared to 14 percent of individuals with private coverage.
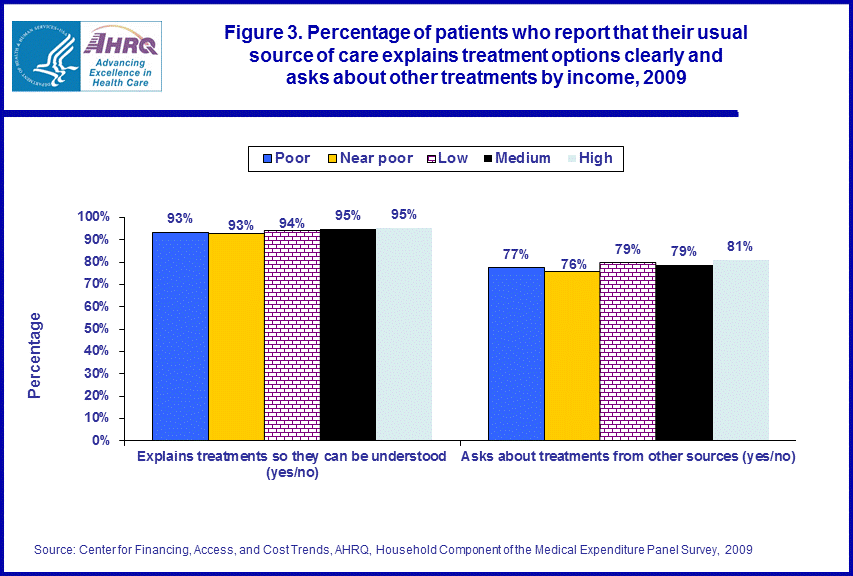
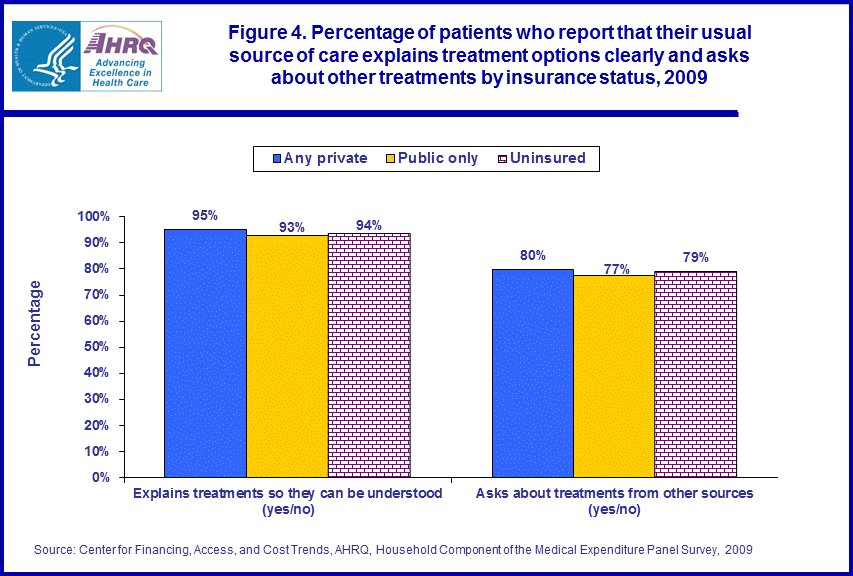
Most individuals also report that their USC provider usually asks about treatments from other providers but this varies modestly by income. Individuals in the two lowest income groups (< 125 percent of FPL) less often report that their USC asks about other treatments compared to those in the highest income group. There are no statistically significant differences by insurance status on this indicator.
Data Source
Estimates for this Statistical Brief come from the MEPS-HC Full Year Consolidated Data File for 2009 (HC-129). The variables used as quality indicators come from the Access to Care Section of the survey, which is fielded in the second and fourth interview rounds (RESPCT42, DECIDE42, EXPLOP42, TREATM42). The variables used for household income, insurance coverage, and for identifying individuals with a usual source of care are POVCAT09, INSCOV09, HAVEUS42, respectively. All estimates are weighted to represent the civilian noninstitutionalized population of the United States. Standard errors for all estimates are adjusted for complex survey design using the SVY commands in Stata 11.0.Definitions
Usual source of careIndividuals reported whether or not they or their family member had a particular doctor's office, clinic, health center, or other place (excluding hospital emergency rooms) to go to for medical care when ill or for health-related advice. Individuals who indicated they had a particular place were considered to have a usual source of care.
Poverty status
We define five income groups based on the percentage of the poverty line for total family income, adjusted for family size and composition. We use five categories: poor (less than 100 percent of the poverty line), near poor (100–125 percent of the poverty line), low income (125–200 percent of the poverty line), middle income (200–400 percent of the poverty line) and high (greater than 400 percent of the poverty line). Income is a family-level variable where all sources of income across all earners in the family are summed to form a total income value. This total income value is then divided by the appropriate poverty line income value adjusted for family size and composition.
Insurance status
Insurance status over the entire year is summarized with three mutually exclusive categories: any private insurance, public only, and uninsured. The private insurance category is made up of individuals who had any private insurance coverage during the year. The public category is composed of individuals who never had private insurance but were covered by public insurance for at least part of the year. Finally, individuals in the uninsured category had no insurance for the entire year.
About MEPS-HC
MEPS-HC is a nationally representative longitudinal survey that collects detailed information on health care utilization and expenditures, health insurance, and health status, as well as a wide variety of social, demographic, and economic characteristics for the U.S. civilian noninstitutionalized population. It is cosponsored by the Agency for Healthcare Research and Quality and the National Center for Health Statistics.For more information about MEPS, call the MEPS information coordinator at AHRQ (301) 427-1406 or visit the MEPS Web site at http://www.meps.ahrq.gov/.
References
For a detailed description of the MEPS-HC survey design, sample design, and methods used to minimize sources of nonsampling error, see the following publications:Cohen, J. Design and Methods of the Medical Expenditure Panel Survey Household Component. MEPS Methodology Report No. 1. AHCPR Pub. No. 97-0026. Rockville, MD: Agency for Health Care Policy and Research, 1997. http://www.meps.ahrq.gov/mepsweb/data_files/publications/mr1/mr1.shtml
Cohen, S. Sample Design of the 1996 Medical Expenditure Panel Survey Household Component. MEPS Methodology Report No. 2. AHCPR Pub. No. 97-0027. Rockville, MD: Agency for Health Care Policy and Research, 1997. http://www.meps.ahrq.gov/mepsweb/data_files/publications/mr2/mr2.shtml
Cohen, S. B. Sample Design of the 1997 Medical Expenditure Panel Survey Household Component. Rockville, MD: Agency for Healthcare Research and Quality, 2000. MEPS Methodology Report No. 11, AHRQ Pub. No. 01-0001. http://www.meps.ahrq.gov/mepsweb/data_files/publications/mr11/mr11.shtml
Cohen, S. Design Strategies and Innovations in the Medical Expenditure Panel Survey. Medical Care, July 2003: 41(7) Supplement: III-5–III-12.
Ezzati-Rice, T. M., Rohde, F., Greenblatt, J. Sample Design of the Medical Expenditure Panel Survey Household Component, 1998–2007. Methodology Report No. 22. March 2008. Agency for Healthcare Research and Quality, Rockville, MD. http://www.meps.ahrq.gov/mepsweb/data_files/publications/mr22/mr22.shtml
Suggested Citation
Kirby, J. B. and Berdahl, T. Indicators of Health Care Quality by Income and Insurance Status among Individuals with a Usual Source of Care, 2009. Statistical Brief #367. April 2012. Agency for Healthcare Research and Quality, Rockville, MD. http://www.meps.ahrq.gov/mepsweb/data_files/publications/st367/stat367.shtmlAHRQ welcomes questions and comments from readers of this publication who are interested in obtaining more information about access, cost, use, financing, and quality of health care in the United States. We also invite you to tell us how you are using this Statistical Brief and other MEPS data and tools and to share suggestions on how MEPS products might be enhanced to further meet your needs. Please e-mail us at MEPSProjectDirector@ahrq.hhs.gov or send a letter to the address below:
Steve B. Cohen, PhD, Director
Center for Financing, Access, and Cost Trends
Agency for Healthcare Research and Quality
540 Gaither Road
Rockville, MD 20850
1 Institute of Medicine Committee on Quality of Health Care in America. Crossing the Quality Chasm: A New Health System for the 21st Century. Washington, D.C.: National Academy Press; 2001.
 |
||||||||||||||||||||||||
|
||||||||||||||||||||||||
|
|
||||||||||||||||||||||||
 |
||||||||||||||||||||||||
|
||||||||||||||||||||||||
|
|
||||||||||||||||||||||||
 |
||||||||||||||||||||||||
|
||||||||||||||||||||||||
|
|
||||||||||||||||||||||||
 |
||||||||||||||||||||||||
|
||||||||||||||||||||||||
|
|
||||||||||||||||||||||||


