
|
|
|
Font Size:
|
||||
|
|
|
|
||||
Chartbook #26: Medical Expenditure Panel Survey Insurance Component 2021 Chartbook
Acknowledgments
This chartbook was prepared by G. Edward Miller, Patricia Keenan, Thomas A. Hegland and Asako S. Moriya of the Division of Research and Modeling, Center for Financing, Access, and Cost Trends (CFACT) in the Agency for Healthcare Research and Quality (AHRQ).
The authors appreciate the efforts of Alon Evron, Abby Woodroffe, Lauren Kestner, Sara Bernate Angulo, Alexis Rittweger, and Luis Martinez of the American Institutes for Research (AIR), Abigail Smith of Insignia, Sean Anderson of Pantheon, and Delia Tano and Embrey Young of Visual Connections in creating the exhibits in the chartbook, compiling the chartbook, and preparing the chartbook for production; the data production work of Brandon Flanders of the U.S. Census Bureau; and the production assistance of Doreen Bonnett, Nicole Shulman, and Michelle Roberts of AHRQ.
Reviewers of this publication were Joel W. Cohen, Director of CFACT, Steven C. Hill (Senior Economist), Salam Abdus (Senior Economist), Paul D. Jacobs (Senior Service Fellow), and Samuel H. Zuvekas (Senior Research Adviser) of the Division of Research and Modeling in CFACT, and Karen Davis of the Division of Survey Operations.
Table of Contents
IntroductionBackground
Data Presentation
References
Executive Summary
Section 1: Health Insurance Offer Rates
Section 2: Employee Eligibility and Enrollment
Section 3: Health Insurance Premiums
Section 4: Employee and Employer Premium Contributions
Section 5: Employee Cost Sharing
The data used in this report are from the Insurance Component of the Medical Expenditure Panel Survey. Information about this survey, including sample design, data collection, sample sizes, and response rates, can be found at https://meps.ahrq.gov/survey_comp/Insurance.jsp.
This product is in the public domain and may be used and reprinted without permission in the United States for noncommercial purposes, unless materials are clearly noted as copyrighted in the document. No one may reproduce copyrighted materials without the permission of the copyright holders. Users outside the United States must get permission from AHRQ to reprint or translate this product. Anyone wanting to reproduce this product for sale must contact AHRQ for permission.
Agency for Healthcare Research and Quality
5600 Fishers Lane
Rockville, MD 20857
www.ahrq.gov
Suggested Citation
Medical Expenditure Panel Survey Insurance Component 2021 Chartbook. Rockville, MD: Agency for Healthcare Research and Quality; October 2022. AHRQ Publication No. 22(23)-0056. https://meps.ahrq.gov/mepsweb/data_files/publications/cb26/cb26.shtml.
Introduction
The Medical Expenditure Panel Survey Insurance Component (MEPS-IC) is an annual survey of private employers and State and local governments. The MEPS-IC produces national and State-level estimates of employer-sponsored insurance, including offered plans, costs, employee eligibility, and number of enrollees. The MEPS-IC is sponsored by the Agency for Healthcare Research and Quality and is fielded by the U.S. Census Bureau.
This chartbook provides both single-year and multiyear trend analyses using private-sector MEPS-IC data from 2009 to 2021. To best convey key information from the MEPS-IC, the report is presented in five sections: Health Insurance Offer Rates; Employee Eligibility and Enrollment; Health Insurance Premiums; Employee and Employer Premium Contributions; and Employee Cost Sharing. Each section provides charts and discussion with links to MEPS-IC data tables that contain the estimates and standard errors for each exhibit.
Many of the estimates in this publication are categorized by firm sizes that are relevant to national healthcare policy. The firm-size categories used in the charts and tables are based on actual employment counts rather than full-time equivalent (FTE) counts, because the MEPS-IC does not collect FTE employment figures.
Each section discusses the estimates to highlight trends and differences by employer and workforce characteristics. If a comparison of estimates is presented in the discussion, any differences are statistically significant at the 0.05 level. In some cases, differences noted in the text, in estimates as well as statistical significance of comparisons, may vary slightly from calculations performed using data in the exhibits, MEPS-IC data available on the MEPS website, or MEPS-IC Statistical Briefs due to rounding. All dollar estimates are nominal (not adjusted for inflation).
Background
The IC is one of three annual component surveys that make up MEPS. The other two components are the Household Component (HC) and the Medical Provider Component (MPC). The HC is a nationally representative survey of the U.S. civilian noninstitutionalized population that collects data at both the person and household levels. The MPC collects information from a sample of physicians, hospitals, home health agencies, and pharmacies that provided services to HC respondents.
The MEPS-IC uses two independent samples: the private sector and the public sector. The private-sector sample is composed of approximately 42,000 business establishments from more than 7 million establishments found on the Business Register at the U.S. Census Bureau, with 5.9 percent of the sample determined during the data collection process to be out of scope. In 2021, the response rate for the private sector was 56.9 percent of the remaining in-scope sample units.
An establishment is a single business entity or location. Firms (also often referred to as companies) can include one or more establishments. An example of a multi-establishment firm is a chain of grocery stores, where the establishments of the firm are the sites of the individual grocery stores. The charts and tables in this publication report characteristics within firm-based size categories.
The public-sector sample of the MEPS-IC selects almost 3,000 State and local government agencies. However, this report focuses only on the private sector. Additional information on MEPS-IC sampling can be found in Sample Design of the 2020 Medical Expenditure Panel Survey Insurance Component (Davis, 2021; PDF).
Data Presentation
For purposes of the analyses presented in this chartbook, the District of Columbia is treated as a State. In addition, exhibits are organized by category (e.g., premium type, firm size), so references to exhibits in the text may not be in numeric order (e.g., Exhibits 3.1, 3.3, and 3.5 instead of 3.1, 3.2, and 3.3).
References
Davis K. Sample Design of the 2020 Medical Expenditure Panel Survey Insurance Component. Methodology Report #34. Rockville, MD: Agency for Healthcare Research and Quality; August 2021. https://meps.ahrq.gov/data_files/publications/mr34/mr34.shtml. Accessed August 30, 2022.
Executive Summary
Overview
Employer-sponsored insurance (ESI) is the primary source of health insurance coverage for individuals under age 65. This chartbook uses data for private-sector establishments in the Medical Expenditure Panel Survey-Insurance Component (MEPS-IC) to describe trends in employer coverage, premiums, and benefits from 2009 to 2021.
The MEPS-IC is an annual survey of private employers and State and local governments and is designed to be representative of all 50 States and the District of Columbia. The large sample size (about 42,000 private-sector establishments), combined with a response rate of 56.9 percent in 2021, permits analyses of variations in ESI by firm size and across States that are not readily available from other sources.
Examining variations by firm size and across States is important due to variation in insurance markets along these dimensions. Historically, insurance markets have differed by firm size due to smaller firms’ more limited ability to pool risk and their higher administrative costs compared with larger firms. State variation in ESI markets may reflect differences in employment patterns, healthcare prices, and utilization, as well as differences in State approaches to regulating private insurance and administering Medicaid.
This chartbook describes trends and patterns in ESI overall, by firm size, and by State from 2009 to 2021. All differences noted are at the 0.05 significance level. All dollar estimates are nominal (not adjusted for inflation).
Summary of Findings
Employee Enrollment in Health Insurance
The overall percentage of private-sector employees covered by a health insurance plan offered by their employers (the "enrollment rate") fell from 49.5 percent in 2020 to 48.0 percent in 2021. There were no significant changes, however, in the enrollment rate within any of the three firm size groups examined in this study.
The enrollment rate reflects the combination of employers’ decisions about offering health insurance and employee eligibility for such coverage, as well as employees’ decisions to take up coverage if eligible. Offer rates, eligibility rates, and take-up rates, as well as coverage rates among employees offered insurance, are described further below.
Availability of Coverage: Offer Rates
Overall, the percentage of private-sector employees working at establishments that offered insurance ("the offer rate") decreased from 86.9 percent in 2020 to 85.7 percent in 2021, returning closer to the 2019 value of 85.3 percent (Exhibit ES.1). This overall change reflects a compositional shift in employment from medium- and large-firm employment toward small-firm employment, largely undoing a similar but directionally opposite compositional shift that occurred in 2020. Offer rates at small (50.4 percent), medium (90.3 percent), and large firms (98.9 percent) were not significantly different from their 2020 values.

Exhibit ES.1: Percentage (standard error) of private-sector employees in establishments that offer health insurance, by firm size, 2009-2021
TABLE SUMMARY
| Number of Employees | 2009 | 2010 | 2011 | 2012 | 2013 | 2014 | 2015 | 2016 | 2017 | 2018 | 2019 | 2020 | 2021 |
|---|---|---|---|---|---|---|---|---|---|---|---|---|---|
| U.S. | 87.6% | 86.5%* | 85.3%* | 84.7% | 84.9% | 83.2%* | 83.8% | 84.3% | 84.5% | 84.6% | 85.3%* | 86.9%* | 85.7%* |
| (Standard Error) | (0.2%) | (0.2%) | (0.2%) | (0.3%) | (0.3%) | (0.3%) | (0.2%) | (0.2%) | (0.2%) | (0.2%) | (0.2%) | (0.2%) | (0.3%) |
| <50 | 59.6% | 57.8%* | 54.7%* | 52.9%* | 53.1% | 49.8%* | 47.6%* | 47.7% | 48.3% | 47.3% | 50.7%* | 50.5% | 50.4%^ |
| (Standard Error) | (0.5%) | (0.5%) | (0.4%) | (0.6%) | (0.7%) | (0.6%) | (0.6%) | (0.6%) | (0.6%) | (0.6%) | (0.7%) | (0.7%) | (0.7%) |
| 50-99 | 89.6% | 87.3% | 85.6% | 84.1% | 87.0% | 83.0%* | 85.3% | 88.6%* | 86.3% | 88.0% | 88.0% | 88.5% | 90.3%^ |
| (Standard Error) | (1.3%) | (0.9%) | (1.0%) | (1.4%) | (1.0%) | (1.3%) | (1.2%) | (1.0%) | (1.2%) | (1.1%) | (1.1%) | (1.2%) | (1.2%) |
| 100+ | 98.8% | 98.5% | 98.1% | 98.2% | 98.0% | 97.3%* | 98.8%* | 98.9% | 98.9% | 99.0% | 99.0% | 98.8% | 98.9% |
| (Standard Error) | (0.1%) | (0.2%) | (0.2%) | (0.2%) | (0.2%) | (0.2%) | (0.2%) | (0.1%) | (0.2%) | (0.2%) | (0.1%) | (0.2%) | (0.2%) |
| Source: Medical Expenditure Panel Survey-Insurance Component, private-sector
establishments, 2009-2021. Note: * indicates the estimate is statistically different from the previous year at p < 0.05. ^ indicates that the estimates for firms with <50 and 50-99 employees are statistically different from the estimate for firms with 100+ employees at p < 0.05. This test is conducted for 2021 only. |
|||||||||||||
Since almost all large firms offer health insurance coverage, offer rates among small firms (fewer than 50 employees) are an important factor contributing to overall differences in State ESI offer rates, along with the distribution of employers by firm size in the State. Overall, the average annual offer rate for 2019-2021 was 50.6 percent for small firms, but there was substantial variation across the United States. Among small firms, 13 States, with average annual offer rates ranging from 33.7 to 45.2 percent, were significantly below the national average. Another 11 States, with average annual offer rates ranging from 55.7 to 90.6 percent, were significantly above the national average for small firms (Exhibit ES.2).
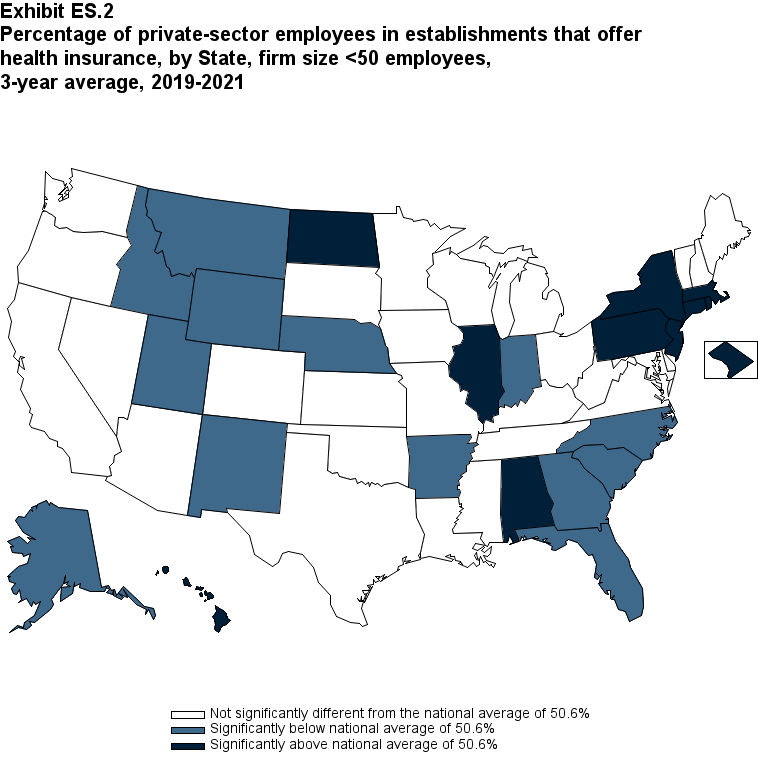
Exhibit ES.2: Percentage (standard error) of private-sector employees in establishments that offer health insurance, by State, firm size <50 employees, 3-year average, 2019-2021
TABLE SUMMARY
| Alabama | 56.5%* | Kentucky | 47.8% | North Dakota | 56.7%* |
|---|---|---|---|---|---|
| (Standard Error) | (2.5%) | (Standard Error) | (2.8%) | (Standard Error) | (2.3%) |
| Alaska | 33.7%* | Louisiana | 47.1% | Ohio | 51.5% |
| (Standard Error) | (2.4%) | (Standard Error) | (2.9%) | (Standard Error) | (2.6%) |
| Arizona | 45.4% | Maine | 47.1% | Oklahoma | 55.4% |
| (Standard Error) | (2.9%) | (Standard Error) | (2.3%) | (Standard Error) | (2.4%) |
| Arkansas | 40.3%* | Maryland | 55.6% | Oregon | 48.7% |
| (Standard Error) | (2.7%) | (Standard Error) | (2.6%) | (Standard Error) | (2.2%) |
| California | 52.4% | Massachusetts | 62.3%* | Pennsylvania | 57.2%* |
| (Standard Error) | (1.6%) | (Standard Error) | (2.6%) | (Standard Error) | (2.1%) |
| Colorado | 49.5% | Michigan | 49.8% | Rhode Island | 59.1%* |
| (Standard Error) | (2.5%) | (Standard Error) | (2.4%) | (Standard Error) | (2.7%) |
| Connecticut | 58.6%* | Minnesota | 48.7% | South Carolina | 41.7%* |
| (Standard Error) | (2.5%) | (Standard Error) | (2.5%) | (Standard Error) | (2.7%) |
| Delaware | 49.9% | Mississippi | 49.6% | South Dakota | 49.1% |
| (Standard Error) | (2.9%) | (Standard Error) | (2.7%) | (Standard Error) | (2.2%) |
| District of Columbia | 73.1%* | Missouri | 52.0% | Tennessee | 46.9% |
| (Standard Error) | (2.6%) | (Standard Error) | (2.4%) | (Standard Error) | (2.6%) |
| Florida | 41.4%* | Montana | 41.6%* | Texas | 47.6% |
| (Standard Error) | (2.2%) | (Standard Error) | (2.2%) | (Standard Error) | (1.7%) |
| Georgia | 42.9%* | Nebraska | 45.2%* | Utah | 42.6%* |
| (Standard Error) | (2.8%) | (Standard Error) | (2.5%) | (Standard Error) | (2.5%) |
| Hawaii | 90.6%* | Nevada | 51.4% | Vermont | 49.8% |
| (Standard Error) | (1.3%) | (Standard Error) | (2.9%) | (Standard Error) | (2.1%) |
| Idaho | 41.3%* | New Hampshire | 53.7% | Virginia | 53.1% |
| (Standard Error) | (2.4%) | (Standard Error) | (2.6%) | (Standard Error) | (2.6%) |
| Illinois | 57.1%* | New Jersey | 59.4%* | Washington | 50.6% |
| (Standard Error) | (1.8%) | (Standard Error) | (2.5%) | (Standard Error) | (2.4%) |
| Indiana | 42.7%* | New Mexico | 42.2%* | West Virginia | 46.1% |
| (Standard Error) | (2.5%) | (Standard Error) | (2.5%) | (Standard Error) | (2.8%) |
| Iowa | 52.3% | New York | 55.7%* | Wisconsin | 47.3% |
| (Standard Error) | (2.3%) | (Standard Error) | (1.6%) | (Standard Error) | (2.4%) |
| Kansas | 55.2% | North Carolina | 42.5%* | Wyoming | 38.6%* |
| (Standard Error) | (2.4%) | (Standard Error) | (2.5%) | (Standard Error) | (2.2%) |
| Source: Medical Expenditure Panel Survey-Insurance Component, private-sector
establishments, 2019-2021. Note: * Statistically different from the national average of 50.6 percent at p < 0.05. Note that the standard error on the national estimate of 50.6 percent is 0.4 percent. |
|||||
Employee Coverage, Eligibility, and Take-Up Rates
Among establishments that offered insurance in 2021, 56.0 percent of employees were enrolled in coverage through their employer (the "coverage rate") and 80.3 percent were eligible for health insurance (the "eligibility rate"). Among eligible employees, 69.8 percent were enrolled in their employer’s health insurance (the "take-up rate"). The overall coverage, eligibility, and take-up rates did not change significantly from 2020 (Exhibits ES.3, ES.4, and ES.5).
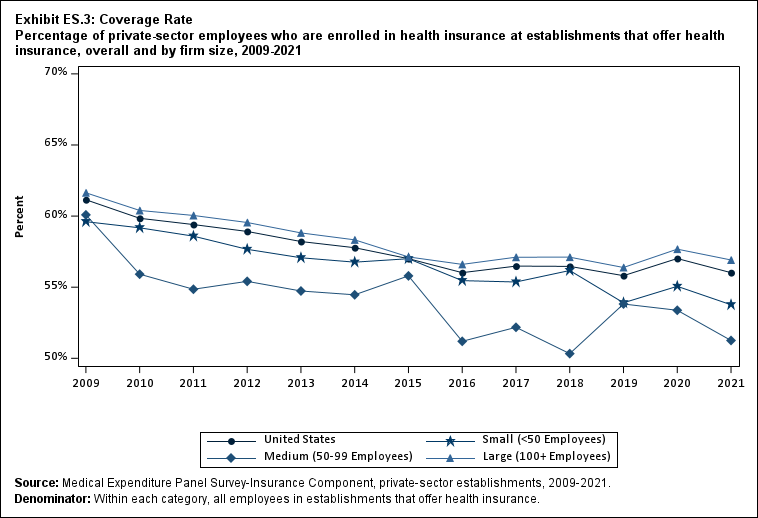
Exhibit ES.3: Coverage Rate Percentage (standard error) of private-sector employees who are enrolled in health insurance at establishments that offer health insurance, overall and by firm size, 2009-2021
TABLE SUMMARY
| Number of Employees | 2009 | 2010 | 2011 | 2012 | 2013 | 2014 | 2015 | 2016 | 2017 | 2018 | 2019 | 2020 | 2021 |
|---|---|---|---|---|---|---|---|---|---|---|---|---|---|
| U.S. | 61.1% | 59.8%* | 59.4% | 58.9% | 58.2% | 57.8% | 57.0% | 56.0% | 56.5% | 56.5% | 55.8% | 57.0% | 56.0% |
| (Standard Error) | (0.4%) | (0.5%) | (0.2%) | (0.4%) | (0.3%) | (0.4%) | (0.4%) | (0.4%) | (0.4%) | (0.4%) | (0.5%) | (0.4%) | (0.4%) |
| <50 | 59.6% | 59.2% | 58.6% | 57.7% | 57.1% | 56.8% | 57.0% | 55.5% | 55.4% | 56.2% | 53.9%* | 55.1% | 53.8%^ |
| (Standard Error) | (0.4%) | (0.6%) | (0.5%) | (0.5%) | (0.5%) | (0.6%) | (0.6%) | (0.6%) | (0.6%) | (0.6%) | (0.6%) | (0.7%) | (0.7%) |
| 50-99 | 60.1% | 55.9%* | 54.9% | 55.4% | 54.7% | 54.5% | 55.8% | 51.2%* | 52.2% | 50.3% | 53.8%* | 53.4% | 51.3%^ |
| (Standard Error) | (1.0%) | (0.8%) | (1.0%) | (1.2%) | (0.8%) | (1.3%) | (1.2%) | (1.2%) | (1.2%) | (1.2%) | (1.2%) | (1.3%) | (1.3%) |
| 100+ | 61.6% | 60.4% | 60.0% | 59.5% | 58.8% | 58.3% | 57.1% | 56.6% | 57.1% | 57.1% | 56.4% | 57.7% | 56.9% |
| (Standard Error) | (0.6%) | (0.6%) | (0.3%) | (0.4%) | (0.3%) | (0.5%) | (0.5%) | (0.5%) | (0.5%) | (0.5%) | (0.6%) | (0.5%) | (0.5%) |
| Source: Medical Expenditure Panel Survey-Insurance Component, private-sector
establishments, 2009-2021. Denominator: Within each category, all employees in establishments that offer health insurance. Note: * indicates the estimate is statistically different from the previous year at p < 0.05. ^ indicates that the estimates for firms with <50 and 50-99 employees are statistically different from the estimate for firms with 100+ employees at p < 0.05. This test is conducted for 2021 only. |
|||||||||||||
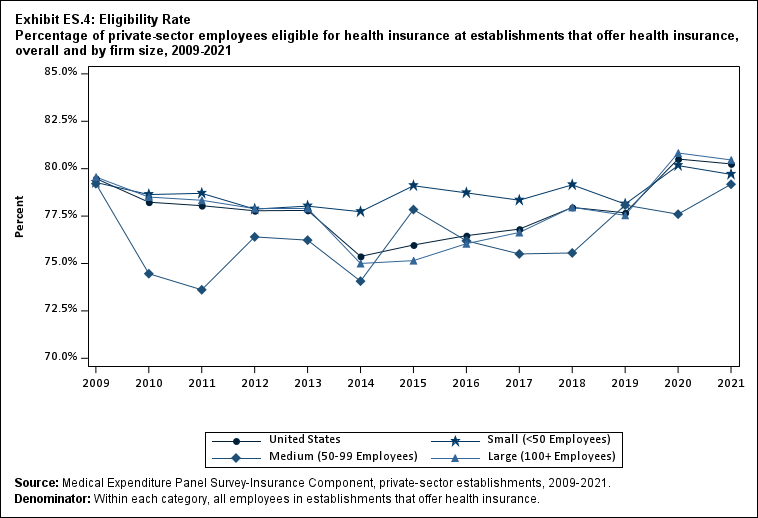
Exhibit ES.4: Eligibility Rate Percentage (standard error) of private-sector employees eligible for health insurance at establishments that offer health insurance, overall and by firm size, 2009-2021
TABLE SUMMARY
| Number of Employees | 2009 | 2010 | 2011 | 2012 | 2013 | 2014 | 2015 | 2016 | 2017 | 2018 | 2019 | 2020 | 2021 |
|---|---|---|---|---|---|---|---|---|---|---|---|---|---|
| U.S. | 79.5% | 78.2%* | 78.0% | 77.8% | 77.8% | 75.4%* | 76.0% | 76.5% | 76.8% | 78.0%* | 77.7% | 80.5%* | 80.3% |
| (Standard Error) | (0.3%) | (0.5%) | (0.4%) | (0.3%) | (0.2%) | (0.4%) | (0.4%) | (0.4%) | (0.4%) | (0.4%) | (0.4%) | (0.4%) | (0.4%) |
| <50 | 79.3% | 78.6% | 78.7% | 77.9% | 78.0% | 77.7% | 79.1% | 78.7% | 78.3% | 79.1% | 78.1% | 80.2%* | 79.7% |
| (Standard Error) | (0.5%) | (0.5%) | (0.6%) | (0.5%) | (0.4%) | (0.6%) | (0.6%) | (0.6%) | (0.6%) | (0.6%) | (0.6%) | (0.6%) | (0.6%) |
| 50-99 | 79.2% | 74.5%* | 73.6% | 76.4% | 76.2% | 74.1% | 77.8%* | 76.2% | 75.5% | 75.6% | 78.1% | 77.6% | 79.2% |
| (Standard Error) | (0.8%) | (0.6%) | (1.0%) | (1.2%) | (0.8%) | (1.4%) | (1.2%) | (1.2%) | (1.2%) | (1.2%) | (1.2%) | (1.4%) | (1.3%) |
| 100+ | 79.6% | 78.5% | 78.3% | 77.9% | 77.9% | 75.0%* | 75.2% | 76.0% | 76.6% | 78.0% | 77.5% | 80.8%* | 80.5% |
| (Standard Error) | (0.5%) | (0.6%) | (0.4%) | (0.3%) | (0.3%) | (0.5%) | (0.5%) | (0.4%) | (0.5%) | (0.5%) | (0.5%) | (0.5%) | (0.4%) |
| Source: Medical Expenditure Panel Survey-Insurance Component, private-sector
establishments, 2009-2021. Denominator: Within each category, all employees in establishments that offer health insurance. Note: * indicates the estimate is statistically different from the previous year at p < 0.05. ^ indicates that the estimates for firms with <50 and 50-99 employees are statistically different from the estimate for firms with 100+ employees at p < 0.05. This test is conducted for 2021 only. |
|||||||||||||

Exhibit ES.5: Take-Up Rate Percentage (standard error) of eligible private-sector employees who are enrolled in health insurance at establishments that offer health insurance, overall and by firm size, 2009-2021
TABLE SUMMARY
| Number of Employees | 2009 | 2010 | 2011 | 2012 | 2013 | 2014 | 2015 | 2016 | 2017 | 2018 | 2019 | 2020 | 2021 |
|---|---|---|---|---|---|---|---|---|---|---|---|---|---|
| U.S. | 76.9% | 76.5% | 76.1% | 75.8% | 74.8%* | 76.7%* | 75.0%* | 73.3%* | 73.5% | 72.4%* | 71.9% | 70.8%* | 69.8% |
| (Standard Error) | (0.3%) | (0.2%) | (0.3%) | (0.3%) | (0.2%) | (0.3%) | (0.3%) | (0.3%) | (0.3%) | (0.4%) | (0.4%) | (0.4%) | (0.4%) |
| <50 | 75.2% | 75.3% | 74.4% | 74.1% | 73.1% | 73.0% | 72.1% | 70.4%* | 70.7% | 71.0% | 69.0%* | 68.7% | 67.5%^ |
| (Standard Error) | (0.3%) | (0.6%) | (0.4%) | (0.4%) | (0.6%) | (0.5%) | (0.5%) | (0.5%) | (0.6%) | (0.6%) | (0.6%) | (0.6%) | (0.7%) |
| 50-99 | 75.9% | 75.1% | 74.5% | 72.5% | 71.8% | 73.5% | 71.7% | 67.2%* | 69.1% | 66.6% | 68.9% | 68.8% | 64.7%*^ |
| (Standard Error) | (0.9%) | (0.7%) | (0.6%) | (0.8%) | (1.0%) | (1.0%) | (1.1%) | (1.2%) | (1.1%) | (1.1%) | (1.0%) | (1.0%) | (1.2%) |
| 100+ | 77.5% | 76.9% | 76.7% | 76.4% | 75.5%* | 77.8%* | 76.0%* | 74.4%* | 74.5% | 73.3%* | 72.7% | 71.4%* | 70.7% |
| (Standard Error) | (0.5%) | (0.3%) | (0.3%) | (0.4%) | (0.3%) | (0.3%) | (0.3%) | (0.4%) | (0.4%) | (0.4%) | (0.5%) | (0.4%) | (0.5%) |
| Source: Medical Expenditure Panel Survey-Insurance Component, private-sector
establishments, 2009-2021. Denominator: Within each category, all employees in establishments that offer health insurance. Note: * indicates the estimate is statistically different from the previous year at p < 0.05. ^ indicates that the estimates for firms with <50 and 50-99 employees are statistically different from the estimate for firms with 100+ employees at p < 0.05. This test is conducted for 2021 only. |
|||||||||||||
Choice of Plans
The overall share of employees at health insurance-offering firms who were offered a choice of two or more health plans did not recover from its reduction in 2020, remaining at 73.9 percent in 2021 relative to the 2019 and 2020 values of 75.8 percent and 73.8 percent, respectively (Exhibit ES.6). In all years from 2009 to 2021, the likelihood that a worker at an offering establishment had a choice of plans increased with firm size.

Exhibit ES.6: Percentage (standard error) of private-sector employees working in establishments that offer two or more health insurance plans, overall and by firm size, 2009-2021
TABLE SUMMARY
| Number of Employees | 2009 | 2010 | 2011 | 2012 | 2013 | 2014 | 2015 | 2016 | 2017 | 2018 | 2019 | 2020 | 2021 |
|---|---|---|---|---|---|---|---|---|---|---|---|---|---|
| U.S. | 66.5% | 65.6% | 65.5% | 65.3% | 66.0% | 67.0% | 70.2%* | 71.7% | 72.4% | 75.7%* | 75.8% | 73.8%* | 73.9% |
| (Standard Error) | (0.7%) | (0.8%) | (0.5%) | (0.7%) | (0.6%) | (0.6%) | (0.5%) | (0.5%) | (0.5%) | (0.5%) | (0.5%) | (0.6%) | (0.6%) |
| <50 | 27.3% | 26.7% | 27.2% | 29.3% | 28.4% | 29.6% | 33.6%* | 34.2% | 34.9% | 37.8%* | 41.4%* | 39.9% | 41.0%^ |
| (Standard Error) | (0.9%) | (0.8%) | (0.9%) | (0.8%) | (1.0%) | (0.9%) | (1.1%) | (1.0%) | (1.0%) | (1.0%) | (1.1%) | (1.1%) | (1.1%) |
| 50-99 | 42.8% | 44.1% | 46.8% | 43.7% | 46.6% | 46.8% | 50.2% | 56.2%* | 59.3% | 56.4% | 58.7% | 58.6% | 60.8%^ |
| (Standard Error) | (2.0%) | (1.9%) | (2.2%) | (1.7%) | (2.2%) | (2.1%) | (2.2%) | (2.0%) | (1.9%) | (1.9%) | (2.0%) | (2.1%) | (2.2%) |
| 100+ | 78.5% | 77.3% | 76.3% | 75.7% | 76.5% | 77.0% | 79.7%* | 80.7% | 81.0% | 84.7%* | 84.5% | 81.0%* | 81.7% |
| (Standard Error) | (0.7%) | (1.0%) | (0.7%) | (0.7%) | (0.7%) | (0.6%) | (0.6%) | (0.6%) | (0.6%) | (0.5%) | (0.6%) | (0.6%) | (0.6%) |
| Source: Medical Expenditure Panel Survey-Insurance Component, private-sector
establishments, 2009-2021. Denominator: Within each category, all employees in establishments that offer health insurance. Note: * indicates the estimate is statistically different from the previous year at p < 0.05. ^ indicates that the estimates for firms with <50 and 50-99 employees are statistically different from the estimate for firms with 100+ employees at p < 0.05. This test is conducted for 2021 only. |
|||||||||||||
Self-Insured Plans
In 2021, the percentage of offering establishments that self-insured at least one plan (40.1 percent) was not significantly changed from the 2020 percentage (Exhibit ES.7).

Exhibit ES.7: Percentage (standard error) of private-sector establishments that offer health insurance that self-insure at least one plan, overall and by detailed firm size, 2009-2021
TABLE SUMMARY
| Number of Employees | 2009 | 2010 | 2011 | 2012 | 2013 | 2014 | 2015 | 2016 | 2017 | 2018 | 2019 | 2020 | 2021 |
|---|---|---|---|---|---|---|---|---|---|---|---|---|---|
| U.S. | 35.1% | 35.8% | 36.9% | 37.2% | 37.6% | 37.2% | 39.0%* | 40.7%* | 39.2% | 38.7% | 39.4% | 41.9%* | 40.1% |
| (Standard Error) | (0.4%) | (0.5%) | (0.5%) | (0.5%) | (0.5%) | (0.5%) | (0.5%) | (0.6%) | (0.6%) | (0.6%) | (0.6%) | (0.7%) | (0.7%) |
| <10 | 14.6% | 13.1% | 12.6% | 14.9% | 15.2% | 14.4% | 15.8% | 19.3%* | 17.7% | 13.1%* | 14.8% | 17.6% | 18.9%^ |
| (Standard Error) | (0.7%) | (0.5%) | (0.8%) | (0.9%) | (0.4%) | (0.8%) | (1.0%) | (1.4%) | (1.4%) | (1.1%) | (1.3%) | (1.7%) | (1.7%) |
| 10-24 | 10.4% | 11.6% | 9.9% | 10.7% | 9.0% | 12.0%* | 10.6% | 13.6%* | 13.3% | 13.8% | 12.2% | 13.1% | 12.0%^ |
| (Standard Error) | (0.4%) | (0.8%) | (0.7%) | (0.7%) | (0.7%) | (1.0%) | (1.0%) | (1.1%) | (1.2%) | (1.2%) | (1.1%) | (1.2%) | (1.0%) |
| 25-99 | 13.4% | 14.3% | 12.2%* | 13.5% | 12.4% | 12.2% | 13.7% | 16.6%* | 16.0% | 12.9%* | 17.2%* | 16.3% | 17.7%^ |
| (Standard Error) | (0.7%) | (0.7%) | (0.7%) | (0.7%) | (0.7%) | (0.8%) | (0.9%) | (0.9%) | (0.9%) | (0.8%) | (0.9%) | (0.9%) | (1.0%) |
| 100-999 | 29.9% | 30.9% | 31.7% | 30.1% | 30.1% | 32.5% | 33.7% | 34.4% | 37.2% | 35.1% | 33.9% | 35.8% | 38.0%^ |
| (Standard Error) | (0.7%) | (0.9%) | (1.1%) | (0.8%) | (1.0%) | (1.2%) | (1.2%) | (1.2%) | (1.3%) | (1.2%) | (1.1%) | (1.2%) | (1.3%) |
| 1,000+ | 85.8% | 86.6% | 87.5% | 87.1% | 88.0% | 84.2%* | 83.8% | 81.9% | 78.6%* | 81.6%* | 83.1% | 77.8%* | 78.1% |
| (Standard Error) | (0.4%) | (0.6%) | (0.5%) | (0.7%) | (0.5%) | (0.8%) | (0.8%) | (0.8%) | (0.8%) | (0.8%) | (0.8%) | (0.9%) | (0.9%) |
| Source: Medical Expenditure Panel Survey-Insurance Component, private-sector
establishments, 2009-2021. Note: * indicates the estimate is statistically different from the previous year at p < 0.05. ^ indicates that the estimates for firms with <10, 10-24, 25-99, and 100-999 employees are statistically different from the estimate for firms with 1,000+ employees at p < 0.05. This test is conducted for 2021 only. |
|||||||||||||
Premiums
In 2021, average total health insurance premiums were $7,380 for single coverage, $14,634 for employee-plus-one coverage, and $21,381 for family coverage, representing increases over 2020 that ranged from 3.0 to 3.2 percent for the three types of coverage (Exhibits ES.8 and ES.9). These 1-year percentage increases were not significantly different from the average annual growth rates from 2009 to 2021, which ranged from 3.9 to 4.2 percent across the three types of coverage.
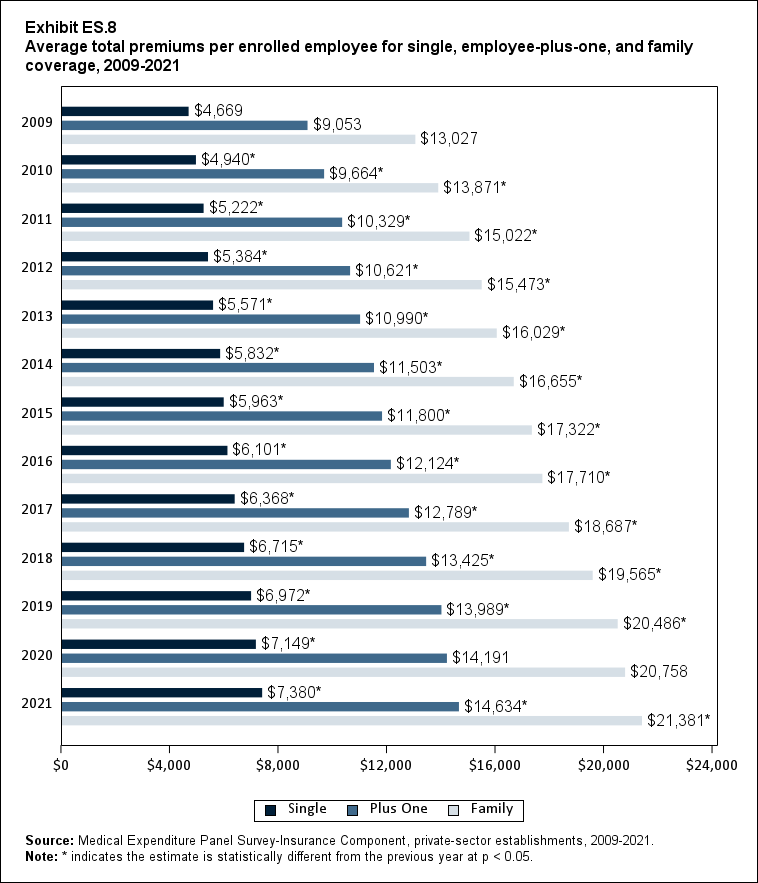
Exhibit ES.8: Average total premiums (standard error) per enrolled employee for single, employee-plus-one and family coverage, 2009-2021
TABLE SUMMARY
| Coverage | 2009 | 2010 | 2011 | 2012 | 2013 | 2014 | 2015 | 2016 | 2017 | 2018 | 2019 | 2020 | 2021 |
|---|---|---|---|---|---|---|---|---|---|---|---|---|---|
| Single | $4,669 | $4,940* | $5,222* | $5,384* | $5,571* | $5,832* | $5,963* | $6,101* | $6,368* | $6,715* | $6,972* | $7,149* | $7,380* |
| (Standard Error) | ($21) | ($22) | ($26) | ($28) | ($23) | ($25) | ($26) | ($27) | ($28) | ($31) | ($35) | ($35) | ($37) |
| Plus One | $9,053 | $9,664* | $10,329* | $10,621* | $10,990* | $11,503* | $11,800* | $12,124* | $12,789* | $13,425* | $13,989* | $14,191 | $14,634* |
| (Standard Error) | ($34) | ($60) | ($105) | ($56) | ($54) | ($60) | ($58) | ($60) | ($70) | ($70) | ($83) | ($93) | ($84) |
| Family | $13,027 | $13,871* | $15,022* | $15,473* | $16,029* | $16,655* | $17,322* | $17,710* | $18,687* | $19,565* | $20,486* | $20,758 | $21,381* |
| (Standard Error) | ($25) | ($75) | ($98) | ($95) | ($61) | ($79) | ($95) | ($84) | ($105) | ($104) | ($125) | ($124) | ($111) |
| Source: Medical Expenditure Panel Survey-Insurance Component, private-sector
establishments, 2009-2021. Note: * indicates the estimate is statistically different from the previous year at p < 0.05. |
|||||||||||||
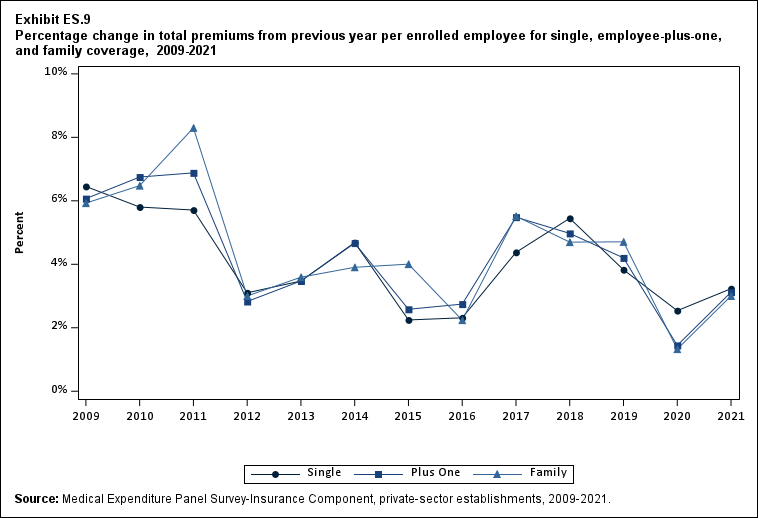
Exhibit ES.9: Percentage change (standard error) in total premiums from previous year per enrolled employee for single, employee-plus-one, and family coverage, 2009-2021
TABLE SUMMARY
| Year | Single | Plus one | Family |
|---|---|---|---|
| 2009 | 6.5%* | 6.1%* | 5.9%* |
| (Standard Error) | ($0.6%) | ($0.7%) | ($0.7%) |
| 2010 | 5.8%* | 6.7%* | 6.5%* |
| (Standard Error) | ($0.7%) | ($0.8%) | ($0.6%) |
| 2011 | 5.7%* | 6.9%* | 8.3%* |
| (Standard Error) | ($0.7%) | ($1.3%) | ($0.9%) |
| 2012 | 3.1%* | 2.8%* | 3.0%* |
| (Standard Error) | ($0.7%) | ($1.2%) | ($0.9%) |
| 2013 | 3.5%* | 3.5%* | 3.6%* |
| (Standard Error) | ($0.7%) | ($0.7%) | ($0.7%) |
| 2014 | 4.7%* | 4.7%* | 3.9%* |
| (Standard Error) | ($0.6%) | ($0.7%) | ($0.6%) |
| 2015 | 2.2%* | 2.6%* | 4.0%* |
| (Standard Error) | ($0.6%) | ($0.7%) | ($0.8%) |
| 2016 | 2.3%* | 2.7%* | 2.2%* |
| (Standard Error) | ($0.6%) | ($0.7%) | ($0.7%) |
| 2017 | 4.4%* | 5.5%* | 5.5%* |
| (Standard Error) | ($0.7%) | ($0.8%) | ($0.8%) |
| 2018 | 5.4%* | 5.0%* | 4.7%* |
| (Standard Error) | ($0.7%) | ($0.8%) | ($0.8%) |
| 2019 | 3.8%* | 4.2%* | 4.7%* |
| (Standard Error) | ($0.7%) | ($0.8%) | ($0.8%) |
| 2020 | 2.5%* | 1.4% | 1.3% |
| (Standard Error) | ($0.7%) | ($0.9%) | ($0.9%) |
| 2021 | 3.2%* | 3.1%* | 3.0%* |
| (Standard Error) | ($0.7%) | ($0.9%) | ($0.8%) |
| Source: Medical Expenditure Panel Survey-Insurance Component, private-sector
establishments, 2009-2021. Note: * indicates the estimate is statistically different from zero at p < 0.05. |
|||
In 2021, there were no differences by firm size in average single and employee-plus one premiums (Exhibits ES.10 and ES. 11).
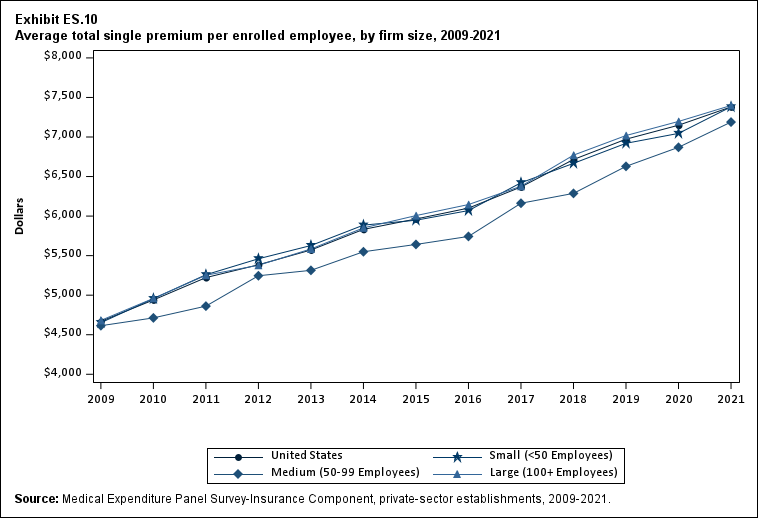
Exhibit ES.10: Average total single premium (standard error) per enrolled employee, by firm size, 2009-2021
TABLE SUMMARY
| Number of Employees | 2009 | 2010 | 2011 | 2012 | 2013 | 2014 | 2015 | 2016 | 2017 | 2018 | 2019 | 2020 | 2021 |
|---|---|---|---|---|---|---|---|---|---|---|---|---|---|
| U.S. | $4,669 | $4,940* | $5,222* | $5,384* | $5,571* | $5,832* | $5,963* | $6,101* | $6,368* | $6,715* | $6,972* | $7,149* | $7,380* |
| (Standard Error) | ($21) | ($22) | ($26) | ($28) | ($23) | ($25) | ($26) | ($27) | ($28) | ($31) | ($35) | ($35) | ($37) |
| <50 | $4,652 | $4,956* | $5,258* | $5,460* | $5,628* | $5,886* | $5,947 | $6,070 | $6,421* | $6,667* | $6,920* | $7,045 | $7,382* |
| (Standard Error) | ($31) | ($34) | ($39) | ($60) | ($39) | ($55) | ($55) | ($53) | ($61) | ($63) | ($73) | ($70) | ($84) |
| 50-99 | $4,614 | $4,713 | $4,861 | $5,246* | $5,314 | $5,549* | $5,642 | $5,743 | $6,163* | $6,287 | $6,629* | $6,870 | $7,189 |
| (Standard Error) | ($82) | ($52) | ($75) | ($39) | ($73) | ($82) | ($104) | ($96) | ($121) | ($111) | ($99) | ($129) | ($129) |
| 100+ | $4,681 | $4,959* | $5,252* | $5,378* | $5,584* | $5,851* | $6,006* | $6,146* | $6,377* | $6,770* | $7,019* | $7,197* | $7,399* |
| (Standard Error) | ($38) | ($23) | ($31) | ($28) | ($29) | ($30) | ($31) | ($32) | ($33) | ($37) | ($42) | ($41) | ($43) |
| Source: Medical Expenditure Panel Survey-Insurance Component, private-sector
establishments, 2009-2021. Note: * indicates the estimate is statistically different from the previous year at p < 0.05. ^ indicates that the estimates for firms with <50 and 50-99 employees are statistically different from the estimate for firms with 100+ employees at p < 0.05. This test is conducted for 2021 only. |
|||||||||||||

Exhibit ES.11: Average total employee-plus-one premium (standard error) per enrolled employee, by firm size, 2009-2021
TABLE SUMMARY
| Number of Employees | 2009 | 2010 | 2011 | 2012 | 2013 | 2014 | 2015 | 2016 | 2017 | 2018 | 2019 | 2020 | 2021 |
|---|---|---|---|---|---|---|---|---|---|---|---|---|---|
| U.S. | $9,053 | $9,664* | $10,329* | $10,621* | $10,990* | $11,503* | $11,800* | $12,124* | $12,789* | $13,425* | $13,989* | $14,191 | $14,634* |
| (Standard Error) | ($34) | ($60) | ($105) | ($56) | ($54) | ($60) | ($58) | ($60) | ($70) | ($70) | ($83) | ($93) | ($84) |
| <50 | $9,124 | $9,850* | $10,253* | $10,524 | $11,050* | $11,386 | $11,666 | $11,833 | $12,558* | $13,044* | $13,619 | $13,522 | $14,326* |
| (Standard Error) | ($119) | ($80) | ($104) | ($121) | ($92) | ($163) | ($158) | ($156) | ($170) | ($176) | ($248) | ($212) | ($262) |
| 50-99 | $8,852 | $9,166 | $9,615* | $10,178* | $10,673 | $10,845 | $10,885 | $11,389 | $11,931 | $12,593* | $13,248 | $13,766 | $14,314 |
| (Standard Error) | ($148) | ($124) | ($192) | ($185) | ($330) | ($187) | ($198) | ($227) | ($232) | ($236) | ($321) | ($246) | ($295) |
| 100+ | $9,058 | $9,669* | $10,394* | $10,672* | $11,006* | $11,571* | $11,892* | $12,225* | $12,878* | $13,537* | $14,105* | $14,304 | $14,703* |
| (Standard Error) | ($34) | ($62) | ($113) | ($70) | ($59) | ($68) | ($66) | ($68) | ($79) | ($79) | ($92) | ($106) | ($93) |
| Source: Medical Expenditure Panel Survey-Insurance Component, private-sector
establishments, 2009-2021. Note: * indicates the estimate is statistically different from the previous year at p < 0.05. ^ indicates that the estimates for firms with <50 and 50-99 employees are statistically different from the estimate for firms with 100+ employees at p < 0.05. This test is conducted for 2021 only. |
|||||||||||||
In 2021, average total premiums for family coverage were higher in large firms ($21,584) than in small ($20,406) and medium ($20,551) firms (Exhibit ES.12).
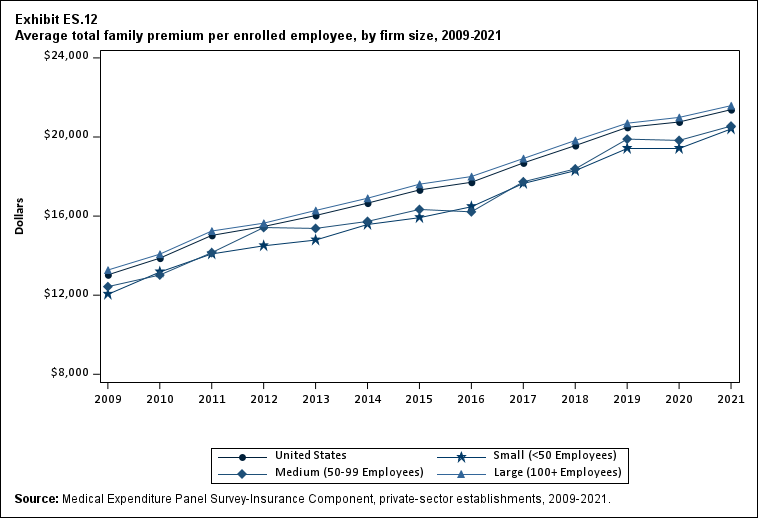
Exhibit ES.12: Average total family premium (standard error) per enrolled employee, by firm size, 2009-2021
TABLE SUMMARY
| Number of Employees | 2009 | 2010 | 2011 | 2012 | 2013 | 2014 | 2015 | 2016 | 2017 | 2018 | 2019 | 2020 | 2021 |
|---|---|---|---|---|---|---|---|---|---|---|---|---|---|
| U.S. | $13,027 | $13,871* | $15,022* | $15,473* | $16,029* | $16,655* | $17,322* | $17,710* | $18,687* | $19,565* | $20,486* | $20,758 | $21,381* |
| (Standard Error) | ($25) | ($75) | ($98) | ($95) | ($61) | ($79) | ($95) | ($84) | ($105) | ($104) | ($125) | ($124) | ($111) |
| <50 | $12,041 | $13,170* | $14,086* | $14,496 | $14,787 | $15,575* | $15,919 | $16,471 | $17,649* | $18,296* | $19,417* | $19,416 | $20,406* |
| (Standard Error) | ($129) | ($111) | ($145) | ($181) | ($89) | ($177) | ($212) | ($207) | ($192) | ($231) | ($303) | ($283) | ($320) |
| 50-99 | $12,431 | $13,019* | $14,151* | $15,421* | $15,376 | $15,732 | $16,336 | $16,214 | $17,735* | $18,386 | $19,893* | $19,827 | $20,551^ |
| (Standard Error) | ($229) | ($153) | ($168) | ($273) | ($268) | ($274) | ($335) | ($348) | ($327) | ($473) | ($435) | ($422) | ($396) |
| 100+ | $13,271 | $14,074* | $15,245* | $15,641* | $16,284* | $16,903* | $17,612* | $18,000* | $18,911* | $19,824* | $20,697* | $20,990 | $21,584* |
| (Standard Error) | ($33) | ($85) | ($117) | ($114) | ($82) | ($91) | ($110) | ($95) | ($122) | ($118) | ($143) | ($139) | ($124) |
| Source: Medical Expenditure Panel Survey-Insurance Component, private-sector
establishments, 2009-2021. Note: * indicates the estimate is statistically different from the previous year at p < 0.05. ^ indicates that the estimates for firms with <50 and 50-99 employees are statistically different from the estimate for firms with 100+ employees at p < 0.05. This test is conducted for 2021 only. |
|||||||||||||
Overall, for 2019-2021, the average annual single premium was $7,103. Seventeen States, with average annual premiums ranging from $6,220 in Arkansas to $6,922 in North Carolina, were significantly below the national average. Twelve States, with average annual premiums ranging from $7,485 in Rhode Island to $8,798 in Alaska, were significantly above the national average (Exhibit ES.13).
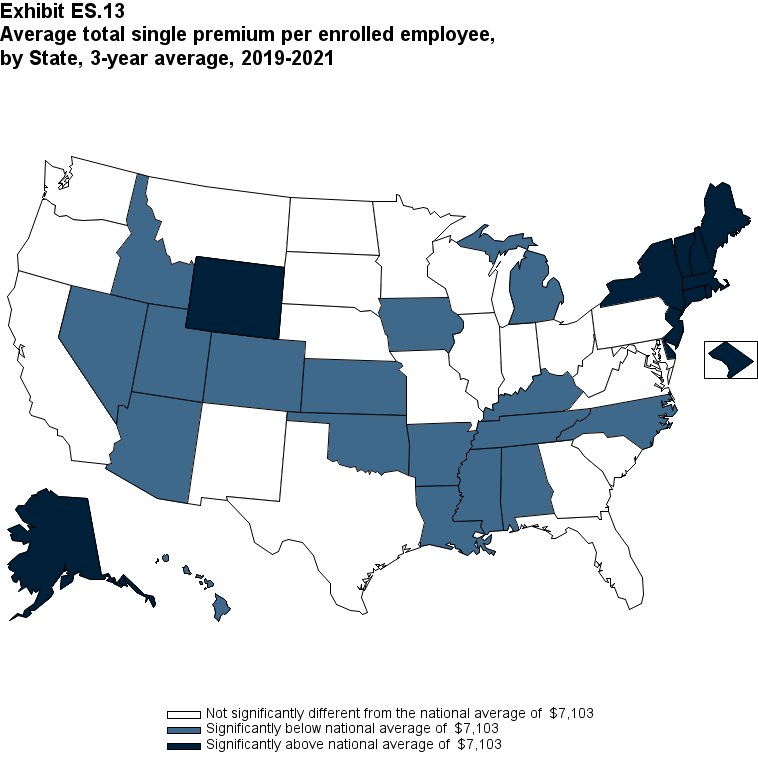
Exhibit ES.13: Average total single premium (standard error) per enrolled employee, by State, 3-year average, 2019-2021
TABLE SUMMARY
| Alabama | $6,481* | Kentucky | $6,918* | North Dakota | $6,998 |
|---|---|---|---|---|---|
| (Standard Error) | ($101) | (Standard Error) | ($88) | (Standard Error) | ($86) |
| Alaska | $8,798* | Louisiana | $6,696* | Ohio | $7,030 |
| (Standard Error) | ($232) | (Standard Error) | ($98) | (Standard Error) | ($100) |
| Arizona | $6,559* | Maine | $7,467* | Oklahoma | $6,893* |
| (Standard Error) | ($92) | (Standard Error) | ($93) | (Standard Error) | ($104) |
| Arkansas | $6,220* | Maryland | $7,182 | Oregon | $6,929 |
| (Standard Error) | ($104) | (Standard Error) | ($116) | (Standard Error) | ($154) |
| California | $7,165 | Massachusetts | $7,623* | Pennsylvania | $7,218 |
| (Standard Error) | ($87) | (Standard Error) | ($101) | (Standard Error) | ($87) |
| Colorado | $6,819* | Michigan | $6,804* | Rhode Island | $7,485* |
| (Standard Error) | ($105) | (Standard Error) | ($116) | (Standard Error) | ($104) |
| Connecticut | $7,512* | Minnesota | $7,020 | South Carolina | $7,091 |
| (Standard Error) | ($113) | (Standard Error) | ($109) | (Standard Error) | ($99) |
| Delaware | $7,701* | Mississippi | $6,533* | South Dakota | $7,133 |
| (Standard Error) | ($162) | (Standard Error) | ($105) | (Standard Error) | ($80) |
| District of Columbia | $7,684* | Missouri | $7,007 | Tennessee | $6,564* |
| (Standard Error) | ($120) | (Standard Error) | ($107) | (Standard Error) | ($90) |
| Florida | $7,002 | Montana | $6,957 | Texas | $6,992 |
| (Standard Error) | ($116) | (Standard Error) | ($98) | (Standard Error) | ($74) |
| Georgia | $6,948 | Nebraska | $7,263 | Utah | $6,454* |
| (Standard Error) | ($131) | (Standard Error) | ($100) | (Standard Error) | ($103) |
| Hawaii | $6,715* | Nevada | $6,550* | Vermont | $7,676* |
| (Standard Error) | ($91) | (Standard Error) | ($122) | (Standard Error) | ($90) |
| Idaho | $6,549* | New Hampshire | $7,662* | Virginia | $6,948 |
| (Standard Error) | ($103) | (Standard Error) | ($103) | (Standard Error) | ($88) |
| Illinois | $7,244 | New Jersey | $7,531* | Washington | $7,232 |
| (Standard Error) | ($82) | (Standard Error) | ($129) | (Standard Error) | ($119) |
| Indiana | $7,238 | New Mexico | $7,165 | West Virginia | $7,287 |
| (Standard Error) | ($102) | (Standard Error) | ($105) | (Standard Error) | ($125) |
| Iowa | $6,798* | New York | $8,126* | Wisconsin | $7,107 |
| (Standard Error) | ($95) | (Standard Error) | ($93) | (Standard Error) | ($100) |
| Kansas | $6,563* | North Carolina | $6,922* | Wyoming | $7,550* |
| (Standard Error) | ($100) | (Standard Error) | ($85) | (Standard Error) | ($159) |
| Source: Medical Expenditure Panel Survey-Insurance Component, private-sector
establishments, 2019-2021. Note: * Statistically different from national average of $7,103 at p < 0.05. Note that the standard error on the national estimate of $7,103 is $20.08. |
|||||
Employee Premium Contributions
In 2021, enrolled employees paid on average 22.3 percent of total premiums for single coverage, 28.7 percent for employee-plus-one coverage, and 28.9 percent for family coverage. Compared with employee shares in 2020, the share for single coverage in 2021 was higher, and the shares for employee-plus-one coverage and family coverage were not significantly different (Exhibit ES.14).
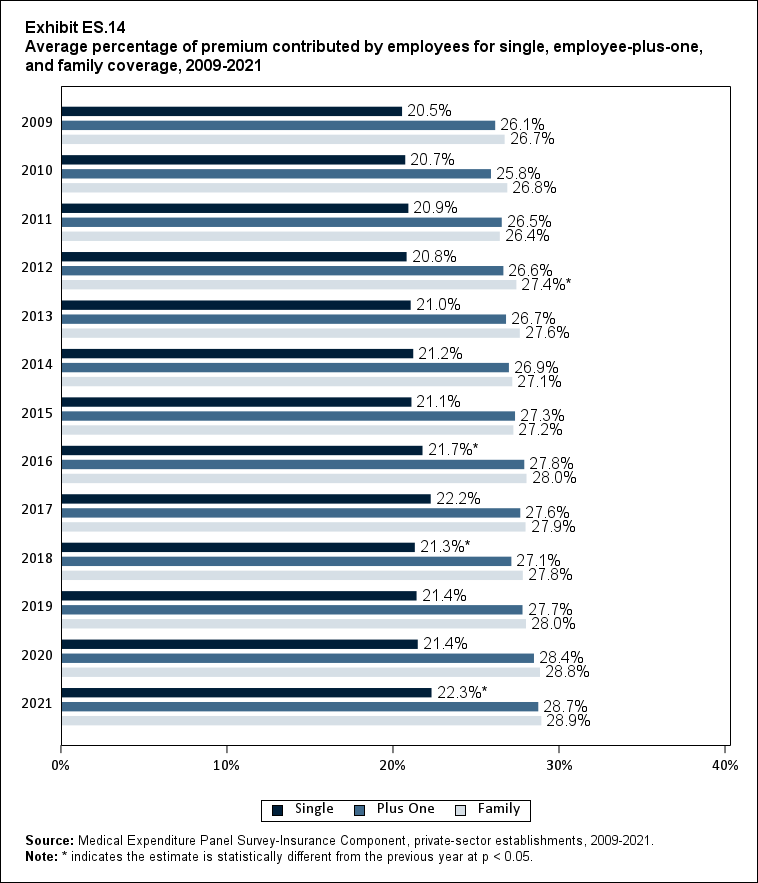
Exhibit ES.14: Average percentage (standard error) of premium contributed by employees for single, employee-plus-one, and family coverage, 2009-2021
TABLE SUMMARY
| Coverage | 2009 | 2010 | 2011 | 2012 | 2013 | 2014 | 2015 | 2016 | 2017 | 2018 | 2019 | 2020 | 2021 |
|---|---|---|---|---|---|---|---|---|---|---|---|---|---|
| Single | 20.5% | 20.7% | 20.9% | 20.8% | 21.0% | 21.2% | 21.1% | 21.7%* | 22.2% | 21.3%* | 21.4% | 21.4% | 22.3%* |
| (Standard Error) | (0.3%) | (0.2%) | (0.2%) | (0.3%) | (0.3%) | (0.2%) | (0.2%) | (0.2%) | (0.2%) | (0.2%) | (0.3%) | (0.2%) | (0.2%) |
| Plus One | 26.1% | 25.8% | 26.5% | 26.6% | 26.7% | 26.9% | 27.3% | 27.8% | 27.6% | 27.1% | 27.7% | 28.4% | 28.7% |
| (Standard Error) | (0.3%) | (0.3%) | (0.3%) | (0.4%) | (0.2%) | (0.3%) | (0.3%) | (0.3%) | (0.3%) | (0.3%) | (0.4%) | (0.4%) | (0.4%) |
| Family | 26.7% | 26.8% | 26.4% | 27.4%* | 27.6% | 27.1% | 27.2% | 28.0% | 27.9% | 27.8% | 28.0% | 28.8% | 28.9% |
| (Standard Error) | (0.3%) | (0.4%) | (0.3%) | (0.4%) | (0.3%) | (0.3%) | (0.3%) | (0.3%) | (0.4%) | (0.3%) | (0.4%) | (0.4%) | (0.4%) |
| Source: Medical Expenditure Panel Survey-Insurance Component, private-sector
establishments, 2009-2021. Note: * indicates the estimate is statistically different from the previous year at p < 0.05. |
|||||||||||||
In 2021, the average employee contribution for single coverage was $1,643, representing an increase of 7.2 percent over the 2020 level (Exhibit ES.15). Average employee contributions in 2021 for employee-plus-one ($4,199) and family ($6,174) coverage were not significantly different from their 2020 levels.
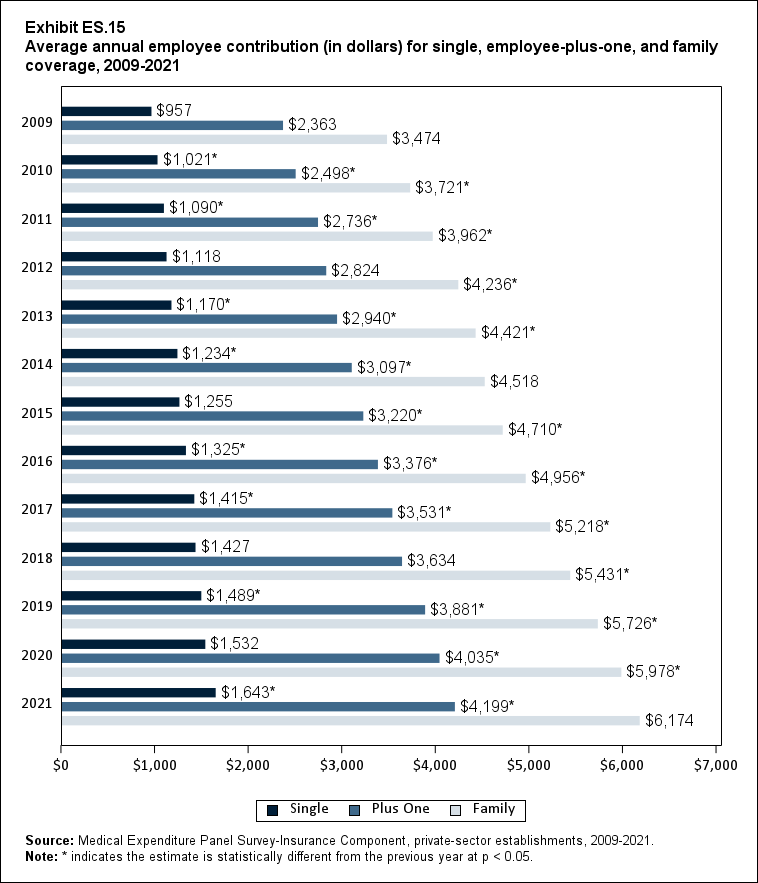
Exhibit ES.15: Average annual employee contribution (in dollars) (standard error) for single, employee-plus-one, and family coverage, 2009-2021
TABLE SUMMARY
| Coverage | 2009 | 2010 | 2011 | 2012 | 2013 | 2014 | 2015 | 2016 | 2017 | 2018 | 2019 | 2020 | 2021 |
|---|---|---|---|---|---|---|---|---|---|---|---|---|---|
| Single | $957 | $1,021* | $1,090* | $1,118 | $1,170* | $1,234* | $1,255 | $1,325* | $1,415* | $1,427 | $1,489* | $1,532 | $1,643* |
| (Standard Error) | ($13) | ($14) | ($9) | ($14) | ($16) | ($13) | ($14) | ($13) | ($15) | ($14) | ($18) | ($16) | ($19) |
| Plus One | $2,363 | $2,498* | $2,736* | $2,824 | $2,940* | $3,097* | $3,220* | $3,376* | $3,531* | $3,634 | $3,881* | $4,035* | $4,199* |
| (Standard Error) | ($27) | ($42) | ($36) | ($46) | ($23) | ($40) | ($35) | ($36) | ($39) | ($39) | ($54) | ($52) | ($64) |
| Family | $3,474 | $3,721* | $3,962* | $4,236* | $4,421* | $4,518 | $4,710* | $4,956* | $5,218* | $5,431* | $5,726* | $5,978* | $6,174 |
| (Standard Error) | ($44) | ($53) | ($42) | ($69) | ($50) | ($48) | ($56) | ($56) | ($64) | ($63) | ($82) | ($76) | ($87) |
| Source: Medical Expenditure Panel Survey-Insurance Component, private-sector
establishments, 2009-2021. Note: * indicates the estimate is statistically different from the previous year at p < 0.05. |
|||||||||||||
Plan Benefits: Deductibles
The percentage of enrollees in a health insurance plan with a deductible in 2021 was not significantly different from 2020 for firms overall (88.5 percent) or among small (86.0), medium (89.7), or large employers (88.8 percent) (Exhibit ES.16).
From 2020 to 2021, the average deductible level for single coverage increased by 3.0 percent, to $2,004 (Exhibit ES.17), and the average family coverage deductible increased by 3.9 percent, to $3,868 (Section 5, Exhibit 5.3).
For both single and family coverage, the average deductible among enrollees with a deductible was higher in small and medium firms than in large firms (Exhibit ES.17; Section 5, Exhibit 5.3).
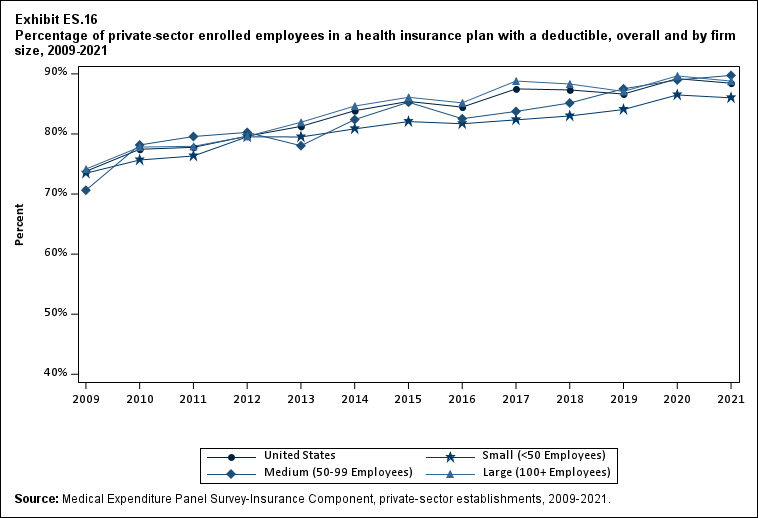
Exhibit ES.16: Percentage (standard error) of private-sector enrolled employees in a health insurance plan with a deductible, overall and by firm size, 2009-2021
TABLE SUMMARY
| Number of Employees | 2009 | 2010 | 2011 | 2012 | 2013 | 2014 | 2015 | 2016 | 2017 | 2018 | 2019 | 2020 | 2021 |
|---|---|---|---|---|---|---|---|---|---|---|---|---|---|
| U.S. | 73.8% | 77.5%* | 77.8% | 79.6%* | 81.3% | 83.9%* | 85.4%* | 84.5% | 87.5%* | 87.3% | 86.6% | 89.2%* | 88.5% |
| (Standard Error) | (0.5%) | (0.3%) | (0.7%) | (0.6%) | (0.7%) | (0.5%) | (0.5%) | (0.5%) | (0.4%) | (0.4%) | (0.5%) | (0.4%) | (0.5%) |
| <50 | 73.5% | 75.7%* | 76.3% | 79.5%* | 79.5% | 80.8% | 82.1% | 81.7% | 82.3% | 83.0% | 84.1% | 86.5%* | 86.0%^ |
| (Standard Error) | (0.7%) | (0.7%) | (0.4%) | (1.0%) | (0.8%) | (0.8%) | (0.8%) | (0.8%) | (0.8%) | (0.8%) | (0.9%) | (0.8%) | (0.9%) |
| 50-99 | 70.6% | 78.2%* | 79.6% | 80.3% | 78.0% | 82.4%* | 85.3% | 82.5% | 83.7% | 85.1% | 87.5% | 89.0% | 89.7% |
| (Standard Error) | (1.9%) | (1.5%) | (1.7%) | (1.4%) | (1.1%) | (1.5%) | (1.5%) | (1.5%) | (1.6%) | (1.4%) | (1.5%) | (1.5%) | (1.3%) |
| 100+ | 74.2% | 77.8%* | 77.9% | 79.6% | 81.9%* | 84.6%* | 86.1% | 85.2% | 88.8%* | 88.3% | 87.1% | 89.7%* | 88.8% |
| (Standard Error) | (0.6%) | (0.3%) | (1.0%) | (0.7%) | (0.7%) | (0.6%) | (0.6%) | (0.6%) | (0.4%) | (0.5%) | (0.5%) | (0.5%) | (0.5%) |
| Source: Medical Expenditure Panel Survey-Insurance Component, private-sector
establishments, 2009-2021. Note: * indicates the estimate is statistically different from the previous year at p < 0.05. ^ indicates that the estimates for firms with <50 and 50-99 employees are statistically different from the estimate for firms with 100+ employees at p < 0.05. This test is conducted for 2021 only. |
|||||||||||||
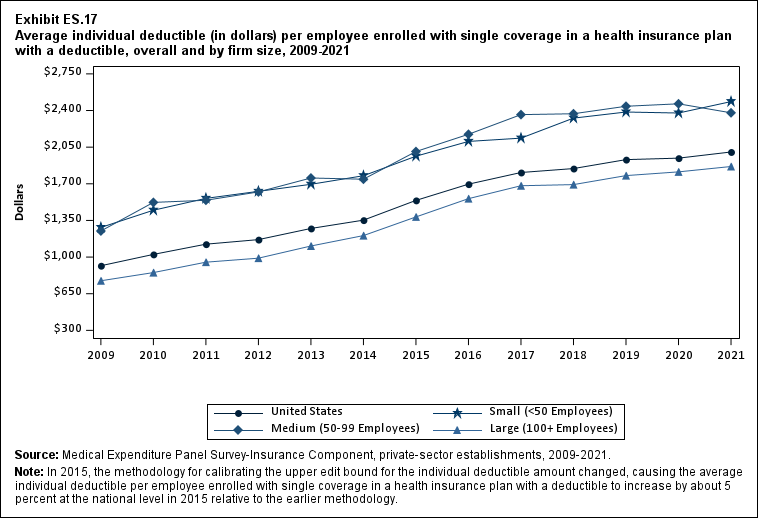
Exhibit ES.17: Average individual deductible (in dollars) (standard error) per employee enrolled with single coverage in a health insurance plan with a deductible, overall and by firm size, 2009-2021
TABLE SUMMARY
| Number of Employees | 2009 | 2010 | 2011 | 2012 | 2013 | 2014 | 2015 | 2016 | 2017 | 2018 | 2019 | 2020 | 2021 |
|---|---|---|---|---|---|---|---|---|---|---|---|---|---|
| U.S. | $917 | $1,025* | $1,123* | $1,167* | $1,273* | $1,353* | $1,541* | $1,696* | $1,808* | $1,846 | $1,931* | $1,945 | $2,004* |
| (Standard Error) | ($9) | ($18) | ($12) | ($8) | ($20) | ($13) | ($16) | ($16) | ($17) | ($17) | ($18) | ($18) | ($20) |
| <50 | $1,283 | $1,447* | $1,561* | $1,628 | $1,695 | $1,777* | $1,964* | $2,105* | $2,136 | $2,327* | $2,386 | $2,376 | $2,485^ |
| (Standard Error) | ($24) | ($21) | ($26) | ($25) | ($24) | ($28) | ($35) | ($34) | ($35) | ($36) | ($35) | ($39) | ($43) |
| 50-99 | $1,249 | $1,522* | $1,543 | $1,622 | $1,755 | $1,744 | $2,008* | $2,173 | $2,361 | $2,369 | $2,441 | $2,464 | $2,378^ |
| (Standard Error) | ($46) | ($57) | ($49) | ($64) | ($49) | ($59) | ($62) | ($64) | ($85) | ($65) | ($67) | ($67) | ($74) |
| 100+ | $774 | $852* | $951* | $989* | $1,106* | $1,205* | $1,383* | $1,558* | $1,681* | $1,692 | $1,778* | $1,814 | $1,865 |
| (Standard Error) | ($7) | ($20) | ($14) | ($10) | ($19) | ($14) | ($18) | ($18) | ($20) | ($19) | ($21) | ($20) | ($23) |
| Source: Medical Expenditure Panel Survey-Insurance Component, private-sector
establishments, 2009-2021. Note: In 2015, the methodology for calibrating the upper edit bound for the individual deductible amount changed, causing the average individual deductible per employee enrolled with single coverage in a heath insurance plan with a deductible to increase by about 5 percent at the national level in 2015 relative to the earlier methodology. * indicates the estimate is statistically different from the previous year at p < 0.05. ^ indicates that the estimates for firms with <50 and 50-99 employees are statistically different from the estimate for firms with 100+ employees at p < 0.05. This test is conducted for 2021 only. |
|||||||||||||
Conclusion
AHRQ produces this chartbook to make MEPS-IC data more readily usable by providing trends nationally and by firm size, by presenting national and State-level estimates in one document, and by providing additional firm-size cross-tabulations relevant to recent policy changes. More information is available at www.meps.ahrq.gov and https://datatools.ahrq.gov/meps-ic. AHRQ welcomes feedback on additional ways to make the data more usable.
Section 1: Health Insurance Offer Rates
This section presents estimates of the percentage of employees who worked where coverage was offered (the "offer rate"), by firm size, State, establishment characteristics (i.e., industry, ownership type, firm age, number of locations, percentage of workers who are full time, and percentage of workers with low wages). It also shows interactions between the percentage of workers with low wages and firm size and between firm size and State. In addition, this section provides information on the prevalence of self-insured plans, availability of dependent coverage, and availability of retiree coverage by firm size. Finally, it shows the percentage of establishments that offer two or more plans, by firm size and establishment characteristics.
In the MEPS IC survey, respondents are asked whether their organization offers, or makes available, any health insurance plans to its active employees. Health insurance plans are defined as policies that provide hospital or physician coverage. The plan may provide this coverage for the employee only, or it may also provide coverage for the employee's dependents through employee-plus-one or family coverage.
Many organizations offer more than one plan. For example, an organization may offer both a high and standard option of a given plan, or it may offer coverage under a health maintenance organization (HMO) and a preferred provider organization (PPO) from the same or a different insurance company. A health plan is self-insured when the financial risk for the enrollee's medical claims is assumed partially or entirely by the organization offering the plan.
Employers' decisions about offering coverage depend on a range of characteristics associated with productivity, workforce demand for coverage, State policy, and other factors. Historically, firm size has been a key determinant of the offer rate, with smaller employers being less likely to offer health insurance coverage than larger employers for a number of reasons, including:
- Smaller risk pools, which result in higher premium costs (holding benefits constant),
- Higher administrative costs per employee, and
- Lack of dedicated staff to select and administer health benefits.
Highlights
- The percentage of employees working at insurance-offering establishments decreased from 86.9 percent in 2020 to 85.7 percent in 2021, returning closer to the 2019 value of 85.3 percent (Exhibit 1.1). This overall change reflects a compositional shift in employment from medium and large firms toward small firms, largely undoing a similar but directionally opposite compositional shift that occurred in 2020.
- The overall share of employees at health insurance-offering firms who were offered a choice of two or more health plans did not recover from its reduction in 2020, remaining at 73.9 percent in 2021 relative to the 2019 and 2020 values of 75.8 percent and 73.8 percent, respectively (Exhibit 1.10).
- Overall, the average annual offer rate for 2019-2021 was 85.9 percent for all firms and 50.6 percent for
small firms (fewer than 50 employees). Offer rates showed substantial variation across the United States
for both groups of employers (Exhibits 1.2 and 1.3):
- Among all firms, the average annual offer rate ranged from 70.8 percent in Wyoming to 97.0 percent in Hawaii.
- Among small firms, 13 States, with average annual offer rates ranging from 33.7 to 45.2 percent, were significantly below the national average. Another 11 States, with average annual offer rates ranging from 55.7 to 90.6 percent, were significantly above the national average for small firms.
Key Trends and Differences
Many longstanding trends related to insurance coverage offers continued in 2021. Establishments in small firms continued to have a significantly lower offer rate than other firms. In addition, small-firm establishments that did offer insurance were less likely to self-insure their plans, offer dependent coverage, offer a choice of two or more plans, or offer retiree coverage.
Dependent coverage, as in prior years, was available to a very high percentage of employees in establishments where health insurance was offered. Availability of retiree coverage of all kinds remained low and very rare outside of large firms.
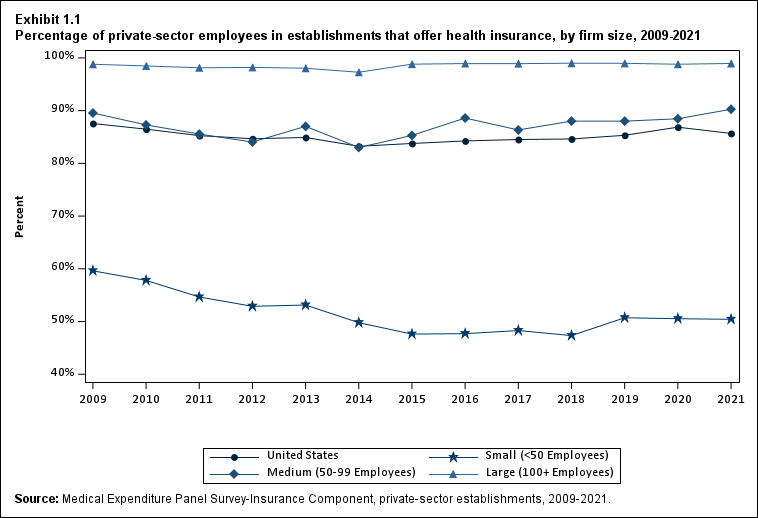
Exhibit 1.1 Percentage (standard error) of private-sector employees in establishments that offer health insurance, by firm size, 2009-2021
| Number of Employees | 2009 | 2010 | 2011 | 2012 | 2013 | 2014 | 2015 | 2016 | 2017 | 2018 | 2019 | 2020 | 2021 |
|---|---|---|---|---|---|---|---|---|---|---|---|---|---|
| U.S. | 87.6% | 86.5%* | 85.3%* | 84.7% | 84.9% | 83.2%* | 83.8% | 84.3% | 84.5% | 84.6% | 85.3%* | 86.9%* | 85.7%* |
| (Standard Error) | (0.2%) | (0.2%) | (0.2%) | (0.3%) | (0.3%) | (0.3%) | (0.2%) | (0.2%) | (0.2%) | (0.2%) | (0.2%) | (0.2%) | (0.3%) |
| <50 | 59.6% | 57.8%* | 54.7%* | 52.9%* | 53.1% | 49.8%* | 47.6%* | 47.7% | 48.3% | 47.3% | 50.7%* | 50.5% | 50.4%^ |
| (Standard Error) | (0.5%) | (0.5%) | (0.4%) | (0.6%) | (0.7%) | (0.6%) | (0.6%) | (0.6%) | (0.6%) | (0.6%) | (0.7%) | (0.7%) | (0.7%) |
| 50-99 | 89.6% | 87.3% | 85.6% | 84.1% | 87.0% | 83.0%* | 85.3% | 88.6%* | 86.3% | 88.0% | 88.0% | 88.5% | 90.3%^ |
| (Standard Error) | (1.3%) | (0.9%) | (1.0%) | (1.4%) | (1.0%) | (1.3%) | (1.2%) | (1.0%) | (1.2%) | (1.1%) | (1.1%) | (1.2%) | (1.2%) |
| 100+ | 98.8% | 98.5% | 98.1% | 98.2% | 98.0% | 97.3%* | 98.8%* | 98.9% | 98.9% | 99.0% | 99.0% | 98.8% | 98.9% |
| (Standard Error) | (0.1%) | (0.2%) | (0.2%) | (0.2%) | (0.2%) | (0.2%) | (0.2%) | (0.1%) | (0.2%) | (0.2%) | (0.1%) | (0.2%) | (0.2%) |
| Source: Medical Expenditure Panel Survey-Insurance Component,
private-sector establishments, 2009-2021. Note: * indicates the estimate is statistically different from the previous year at p < 0.05. ^ indicates that the estimates for firms with <50 and 50-99 employees are statistically different from the estimate for firms with 100+ employees at p < 0.05. This test is conducted for 2021 only. |
|||||||||||||
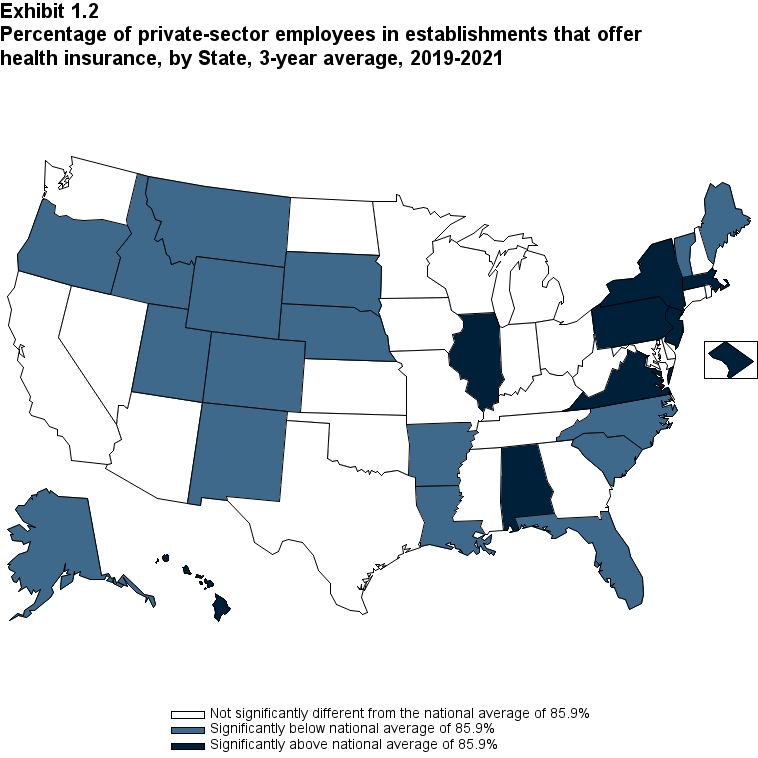
Exhibit 1.2 Percentage (standard error) of private-sector employees in establishments that offer, health insurance, by State, 3-year average, 2019-2021
| Alabama | 88.1%* | Kentucky | 87.1% | North Dakota | 84.9% |
| (Standard Error) | (0.8%) | (Standard Error) | (0.8%) | (Standard Error) | (0.8%) |
| Alaska | 76.8%* | Louisiana | 82.9%* | Ohio | 87.1% |
| (Standard Error) | (1.2%) | (Standard Error) | (1.1%) | (Standard Error) | (0.8%) |
| Arizona | 86.1% | Maine | 81.5%* | Oklahoma | 85.5% |
| (Standard Error) | (1.0%) | (Standard Error) | (0.9%) | (Standard Error) | (0.8%) |
| Arkansas | 82.8%* | Maryland | 87.1% | Oregon | 82.2%* |
| (Standard Error) | (0.9%) | (Standard Error) | (0.9%) | (Standard Error) | (1.0%) |
| California | 86.2% | Massachusetts | 89.8%* | Pennsylvania | 88.8%* |
| (Standard Error) | (0.5%) | (Standard Error) | (0.8%) | (Standard Error) | (0.6%) |
| Colorado | 83.5%* | Michigan | 85.5% | Rhode Island | 87.2% |
| (Standard Error) | (1.0%) | (Standard Error) | (0.9%) | (Standard Error) | (0.9%) |
| Connecticut | 87.3% | Minnesota | 85.3% | South Carolina | 84.2%* |
| (Standard Error) | (0.9%) | (Standard Error) | (0.9%) | (Standard Error) | (0.8%) |
| Delaware | 86.4% | Mississippi | 85.5% | South Dakota | 81.6%* |
| (Standard Error) | (1.0%) | (Standard Error) | (0.9%) | (Standard Error) | (0.9%) |
| District of Columbia | 94.5%* | Missouri | 87.2% | Tennessee | 87.3% |
| (Standard Error) | (0.5%) | (Standard Error) | (0.8%) | (Standard Error) | (0.8%) |
| Florida | 83.9%* | Montana | 71.6%* | Texas | 84.7% |
| (Standard Error) | (0.8%) | (Standard Error) | (1.2%) | (Standard Error) | (0.7%) |
| Georgia | 86.1% | Nebraska | 82.8%* | Utah | 81.6%* |
| (Standard Error) | (0.9%) | (Standard Error) | (1.0%) | (Standard Error) | (1.0%) |
| Hawaii | 97.0%* | Nevada | 86.8% | Vermont | 80.8%* |
| (Standard Error) | (0.5%) | (Standard Error) | (0.9%) | (Standard Error) | (0.9%) |
| Idaho | 76.8%* | New Hampshire | 86.2% | Virginia | 87.8%* |
| (Standard Error) | (1.2%) | (Standard Error) | (0.9%) | (Standard Error) | (0.8%) |
| Illinois | 88.4%* | New Jersey | 88.1%* | Washington | 83.8% |
| (Standard Error) | (0.6%) | (Standard Error) | (0.8%) | (Standard Error) | (1.1%) |
| Indiana | 86.0% | New Mexico | 78.3%* | West Virginia | 84.9% |
| (Standard Error) | (0.7%) | (Standard Error) | (1.3%) | (Standard Error) | (0.9%) |
| Iowa | 86.9% | New York | 87.5%* | Wisconsin | 85.0% |
| (Standard Error) | (0.7%) | (Standard Error) | (0.5%) | (Standard Error) | (0.8%) |
| Kansas | 86.2% | North Carolina | 83.5%* | Wyoming | 70.8%* |
| (Standard Error) | (0.8%) | (Standard Error) | (0.9%) | (Standard Error) | (1.3%) |
| Source: Medical Expenditure Panel Survey-Insurance Component,
private-sector establishments, 2019-2021. Note: * Statistically different from the national average of 85.9 percent at p < 0.05. Note that the standard error on the national estimate of 85.9 percent is 0.1 percent. |
|||||
|---|---|---|---|---|---|
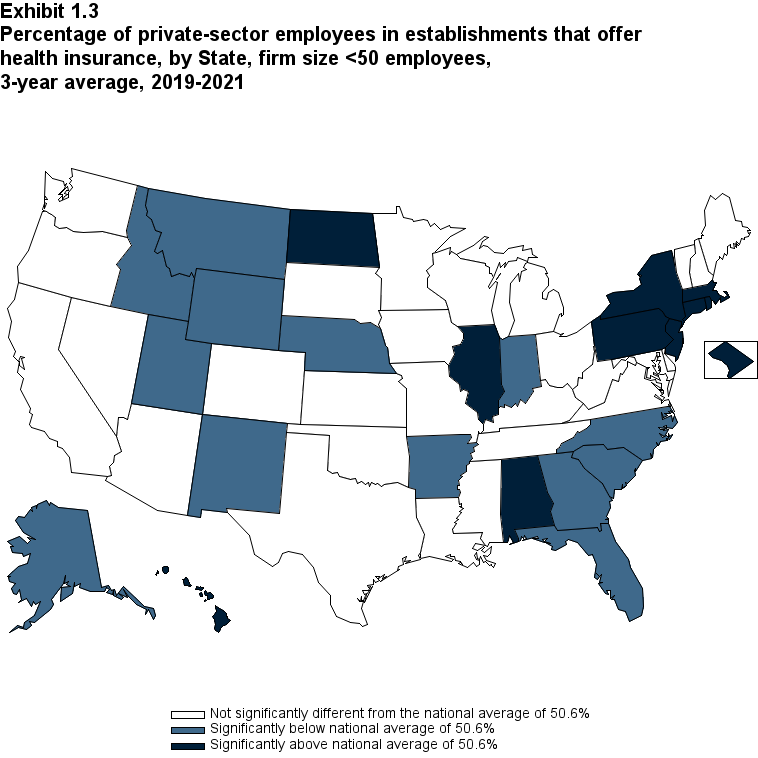
Exhibit 1.3 Percentage (standard error) of private-sector employees in establishments that offer health insurance, by State, firm size <50 employees, by State, 3-year average, 2019-2021
| Alabama | 56.5%* | Kentucky | 47.8% | North Dakota | 56.7%* |
| (Standard Error) | (2.5%) | (Standard Error) | (2.8%) | (Standard Error) | (2.3%) |
| Alaska | 33.7%* | Louisiana | 47.1% | Ohio | 51.5% |
| (Standard Error) | (2.4%) | (Standard Error) | (2.9%) | (Standard Error) | (2.6%) |
| Arizona | 45.4% | Maine | 47.1% | Oklahoma | 55.4% |
| (Standard Error) | (2.9%) | (Standard Error) | (2.3%) | (Standard Error) | (2.4%) |
| Arkansas | 40.3%* | Maryland | 55.6% | Oregon | 48.7% |
| (Standard Error) | (2.7%) | (Standard Error) | (2.6%) | (Standard Error) | (2.2%) |
| California | 52.4% | Massachusetts | 62.3%* | Pennsylvania | 57.2%* |
| (Standard Error) | (1.6%) | (Standard Error) | (2.6%) | (Standard Error) | (2.1%) |
| Colorado | 49.5% | Michigan | 49.8% | Rhode Island | 59.1%* |
| (Standard Error) | (2.5%) | (Standard Error) | (2.4%) | (Standard Error) | (2.7%) |
| Connecticut | 58.6%* | Minnesota | 48.7% | South Carolina | 41.7%* |
| (Standard Error) | (2.5%) | (Standard Error) | (2.5%) | (Standard Error) | (2.7%) |
| Delaware | 49.9% | Mississippi | 49.6% | South Dakota | 49.1% |
| (Standard Error) | (2.9%) | (Standard Error) | (2.7%) | (Standard Error) | (2.2%) |
| District of Columbia | 73.1%* | Missouri | 52.0% | Tennessee | 46.9% |
| (Standard Error) | (2.6%) | (Standard Error) | (2.4%) | (Standard Error) | (2.6%) |
| Florida | 41.4%* | Montana | 41.6%* | Texas | 47.6% |
| (Standard Error) | (2.2%) | (Standard Error) | (2.2%) | (Standard Error) | (1.7%) |
| Georgia | 42.9%* | Nebraska | 45.2%* | Utah | 42.6%* |
| (Standard Error) | (2.8%) | (Standard Error) | (2.5%) | (Standard Error) | (2.5%) |
| Hawaii | 90.6%* | Nevada | 51.4% | Vermont | 49.8% |
| (Standard Error) | (1.3%) | (Standard Error) | (2.9%) | (Standard Error) | (2.1%) |
| Idaho | 41.3%* | New Hampshire | 53.7% | Virginia | 53.1% |
| (Standard Error) | (2.4%) | (Standard Error) | (2.6%) | (Standard Error) | (2.6%) |
| Illinois | 57.1%* | New Jersey | 59.4%* | Washington | 50.6% |
| (Standard Error) | (1.8%) | (Standard Error) | (2.5%) | (Standard Error) | (2.4%) |
| Indiana | 42.7%* | New Mexico | 42.2%* | West Virginia | 46.1% |
| (Standard Error) | (2.5%) | (Standard Error) | (2.5%) | (Standard Error) | (2.8%) |
| Iowa | 52.3% | New York | 55.7%* | Wisconsin | 47.3% |
| (Standard Error) | (2.3%) | (Standard Error) | (1.6%) | (Standard Error) | (2.4%) |
| Kansas | 55.2% | North Carolina | 42.5%* | Wyoming | 38.6%* |
| (Standard Error) | (2.4%) | (Standard Error) | (2.5%) | (Standard Error) | (2.2%) |
| Source: Medical Expenditure Panel Survey-Insurance Component,
private-sector establishments, 2019-2021. Note: * Statistically different from the national average of 50.6 percent at p < 0.05. Note that the standard error on the national estimate of 50.6 percent is 0.4 percent. |
|||||
|---|---|---|---|---|---|
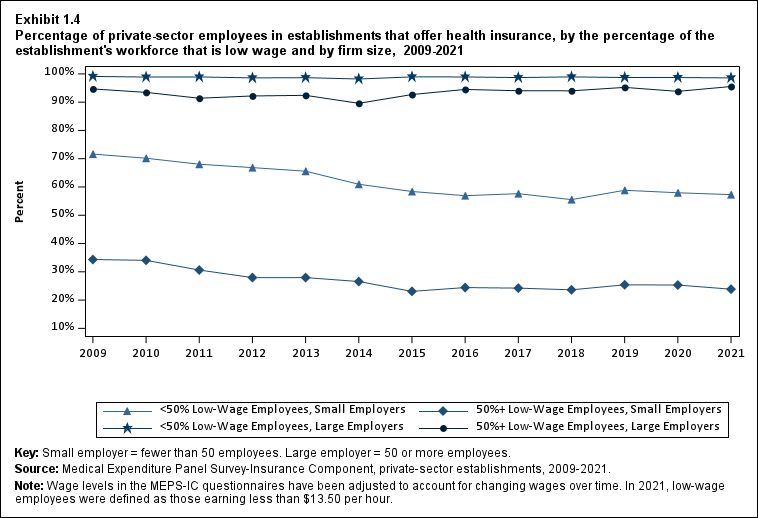
Exhibit 1.4 Percentage (standard error) of private-sector employees in establishments that offer health insurance, by the percentage of the establishment's workforce that is low wage and by firm size, 2009-2021
| Low Wage | 2009 | 2010 | 2011 | 2012 | 2013 | 2014 | 2015 | 2016 | 2017 | 2018 | 2019 | 2020 | 2021 |
|---|---|---|---|---|---|---|---|---|---|---|---|---|---|
| <50% Low-Wage Employees, Small Employers | 71.6% | 70.2%* | 68.0%* | 66.8%* | 65.6%* | 61.0%* | 58.4%* | 56.9% | 57.6% | 55.5%* | 58.8%* | 58.0% | 57.3% |
| (Standard Error) | (0.5%) | (0.5%) | (0.4%) | (0.3%) | (0.6%) | (0.7%) | (0.7%) | (0.7%) | (0.7%) | (0.7%) | (0.8%) | (0.8%) | (0.8%) |
| 50%+ Low-Wage Employees, Small Employers | 34.3% | 34.1% | 30.6%* | 28.0%* | 28.0% | 26.6% | 23.1%* | 24.4% | 24.2% | 23.6% | 25.4% | 25.3% | 23.9%^ |
| (Standard Error) | (0.8%) | (0.7%) | (0.9%) | (1.0%) | (1.2%) | (1.1%) | (1.1%) | (1.3%) | (1.2%) | (1.2%) | (1.4%) | (1.4%) | (1.4%) |
| <50% Low-Wage Employees, Large Employers | 99.1% | 98.9% | 98.9% | 98.6% | 98.7% | 98.2%* | 98.9%* | 98.9% | 98.7% | 98.9% | 98.7% | 98.7% | 98.6% |
| (Standard Error) | (0.2%) | (0.2%) | (0.2%) | (0.1%) | (0.1%) | (0.2%) | (0.1%) | (0.2%) | (0.2%) | (0.1%) | (0.2%) | (0.2%) | (0.2%) |
| 50%+ Low-Wage Employees, Large Employers | 94.7% | 93.5% | 91.4%* | 92.2% | 92.4% | 89.6%* | 92.7%* | 94.5%* | 94.0% | 94.0% | 95.2% | 93.8% | 95.5%^ |
| (Standard Error) | (0.4%) | (0.6%) | (0.7%) | (0.6%) | (0.7%) | (0.7%) | (0.6%) | (0.5%) | (0.6%) | (0.8%) | (0.5%) | (1.0%) | (0.6%) |
| Key: Small employers = fewer than 50 employees. Large employers =
50 or more employees. Source: Medical Expenditure Panel Survey-Insurance Component, private-sector establishments, 2009-2021. Note: Wage levels in the MEPS-IC questionnaires have been adjusted to account for changing wages over time. In 2021, low-wage employees were defined as those earning less than $13.50 per hour. * indicates the estimate is statistically different from the previous year at p < 0.05. ^ indicates that the estimates for small (large) employers with 50%%+ low wage employees are statistically different from the estimate for small (large) employers with < 50%% percent low wage employees at p < 0.05. This test is conducted for 2021 only. |
|||||||||||||
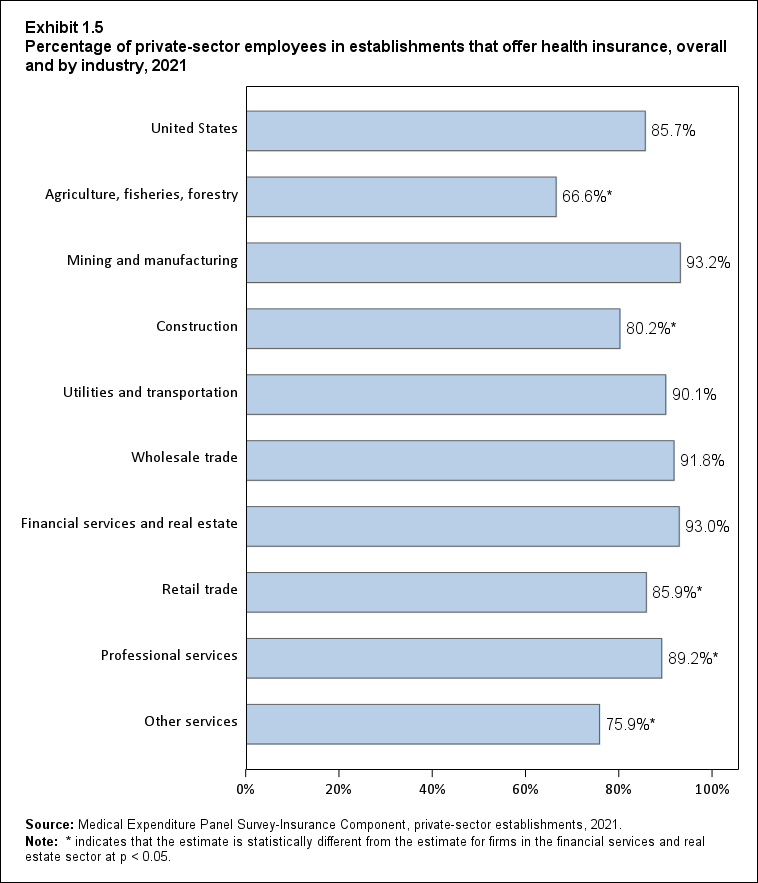
Exhibit 1.5 Percentage (standard error) of private-sector employees in establishments that offer health insurance, overall and by industry, 2021
| Industry | Percentage |
|---|---|
| United States | 85.7% |
| (Standard Error) | (0.3%) |
| Agriculture, fisheries, forestry | 66.6%* |
| (Standard Error) | (6.1%) |
| Mining and manufacturing | 93.2% |
| (Standard Error) | (0.6%) |
| Construction | 80.2%* |
| (Standard Error) | (1.4%) |
| Utilities and transportation | 90.1% |
| (Standard Error) | (1.4%) |
| Wholesale trade | 91.8% |
| (Standard Error) | (0.9%) |
| Financial services and real estate | 93.0% |
| (Standard Error) | (0.7%) |
| Retail trade | 85.9%* |
| (Standard Error) | (0.9%) |
| Professional services | 89.2%* |
| (Standard Error) | (0.4%) |
| Other services | 75.9%* |
| (Standard Error) | (0.8%) |
| Source: Medical Expenditure Panel Survey-Insurance Component,
private-sector establishments, 2021. Note: * indicates that the estimate is statistically different from the estimate for firms in the financial services and real estate sector at p < 0.05. |
|
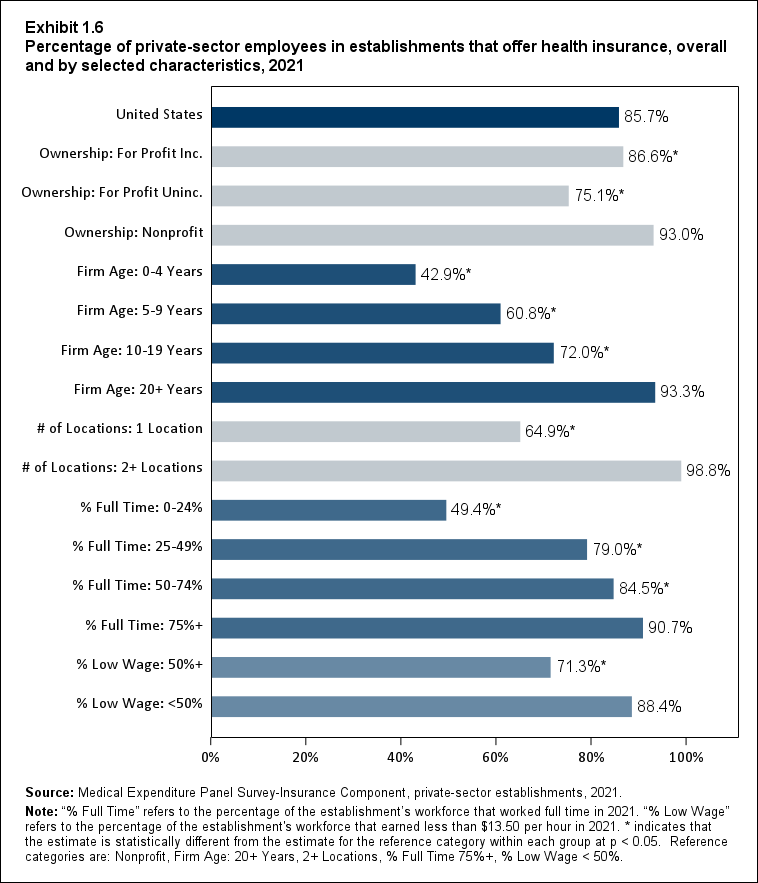
Exhibit 1.6 Percentage (standard error) of private-sector employees in establishments that offer health insurance, overall and by selected characteristics, 2021
| Employer Characteristics | Percentage |
|---|---|
| United States | 85.7% |
| (Standard Error) | (0.3%) |
| Ownership: For Profit Inc. | 86.6%* |
| (Standard Error) | (0.3%) |
| Ownership: For Profit Uninc. | 75.1%* |
| (Standard Error) | (1.0%) |
| Ownership: Nonprofit | 93.0% |
| (Standard Error) | (0.6%) |
| Firm Age: 0-4 Years | 42.9%* |
| (Standard Error) | (2.2%) |
| Firm Age: 5-9 Years | 60.8%* |
| (Standard Error) | (1.9%) |
| Firm Age: 10-19 Years | 72.0%* |
| (Standard Error) | (1.1%) |
| Firm Age: 20+ Years | 93.3% |
| (Standard Error) | (0.2%) |
| # of Locations: 1 Location | 64.9%* |
| (Standard Error) | (0.7%) |
| # of Locations: 2+ Locations | 98.8% |
| (Standard Error) | (0.1%) |
| % Full Time: 0-24% | 49.4%* |
| (Standard Error) | (1.9%) |
| % Full Time: 25-49% | 79.0%* |
| (Standard Error) | (1.2%) |
| % Full Time: 50-74% | 84.5%* |
| (Standard Error) | (0.8%) |
| % Full Time: 75%+ | 90.7% |
| (Standard Error) | (0.3%) |
| % Low Wage: 50%+ | 71.3%* |
| (Standard Error) | (1.1%) |
| % Low Wage: <50% | 88.4% |
| (Standard Error) | (0.3%) |
| Source: Medical Expenditure Panel Survey-Insurance Component,
private-sector establishments, 2021. Note: "Full Time" refers to the percentage of the establishment's workforce that worked full time in 2021. "Low Wage" refers to the percentage of the establishment's workforce that earned less than $13.50 per hour in 2021. * indicates that the estimate is statistically different from the estimate for the reference category within each group at p < 0.05. Reference categories are: Nonprofit, Firm Age: 20+ Years, 2+ Locations, % Full Time 75%+, % Low Wage < 50%. |
|
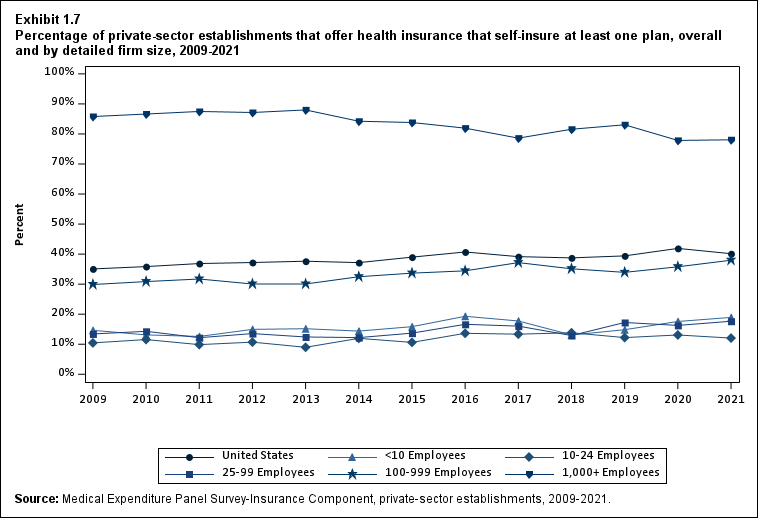
Exhibit 1.7 Percentage (standard error) of private-sector establishments that offer health insurance that self-insure at least one plan, overall and by detailed firm size, 2009-2021
| Number of Employees | 2009 | 2010 | 2011 | 2012 | 2013 | 2014 | 2015 | 2016 | 2017 | 2018 | 2019 | 2020 | 2021 |
|---|---|---|---|---|---|---|---|---|---|---|---|---|---|
| U.S. | 35.1% | 35.8% | 36.9% | 37.2% | 37.6% | 37.2% | 39.0%* | 40.7%* | 39.2% | 38.7% | 39.4% | 41.9%* | 40.1% |
| (Standard Error) | (0.4%) | (0.5%) | (0.5%) | (0.5%) | (0.5%) | (0.5%) | (0.5%) | (0.6%) | (0.6%) | (0.6%) | (0.6%) | (0.7%) | (0.7%) |
| <10 | 14.6% | 13.1% | 12.6% | 14.9% | 15.2% | 14.4% | 15.8% | 19.3%* | 17.7% | 13.1%* | 14.8% | 17.6% | 18.9%^ |
| (Standard Error) | (0.7%) | (0.5%) | (0.8%) | (0.9%) | (0.4%) | (0.8%) | (1.0%) | (1.4%) | (1.4%) | (1.1%) | (1.3%) | (1.7%) | (1.7%) |
| 10-24 | 10.4% | 11.6% | 9.9% | 10.7% | 9.0% | 12.0%* | 10.6% | 13.6%* | 13.3% | 13.8% | 12.2% | 13.1% | 12.0%^ |
| (Standard Error) | (0.4%) | (0.8%) | (0.7%) | (0.7%) | (0.7%) | (1.0%) | (1.0%) | (1.1%) | (1.2%) | (1.2%) | (1.1%) | (1.2%) | (1.0%) |
| 25-99 | 13.4% | 14.3% | 12.2%* | 13.5% | 12.4% | 12.2% | 13.7% | 16.6%* | 16.0% | 12.9%* | 17.2%* | 16.3% | 17.7%^ |
| (Standard Error) | (0.7%) | (0.7%) | (0.7%) | (0.7%) | (0.7%) | (0.8%) | (0.9%) | (0.9%) | (0.9%) | (0.8%) | (0.9%) | (0.9%) | (1.0%) |
| 100-999 | 29.9% | 30.9% | 31.7% | 30.1% | 30.1% | 32.5% | 33.7% | 34.4% | 37.2% | 35.1% | 33.9% | 35.8% | 38.0%^ |
| (Standard Error) | (0.7%) | (0.9%) | (1.1%) | (0.8%) | (1.0%) | (1.2%) | (1.2%) | (1.2%) | (1.3%) | (1.2%) | (1.1%) | (1.2%) | (1.3%) |
| 1,000+ | 85.8% | 86.6% | 87.5% | 87.1% | 88.0% | 84.2%* | 83.8% | 81.9% | 78.6%* | 81.6%* | 83.1% | 77.8%* | 78.1% |
| (Standard Error) | (0.4%) | (0.6%) | (0.5%) | (0.7%) | (0.5%) | (0.8%) | (0.8%) | (0.8%) | (0.8%) | (0.8%) | (0.8%) | (0.9%) | (0.9%) |
| Source: Medical Expenditure Panel Survey-Insurance Component,
private-sector establishments, 2009-2021. Note: * indicates the estimate is statistically different from the previous year at p < 0.05. ^ indicates that the estimates for firms with <10, 10-24, 25-99, and 100-999 employees are statistically different from the estimate for firms with 1,000+ employees at p < 0.05. This test is conducted for 2021 only. |
|||||||||||||
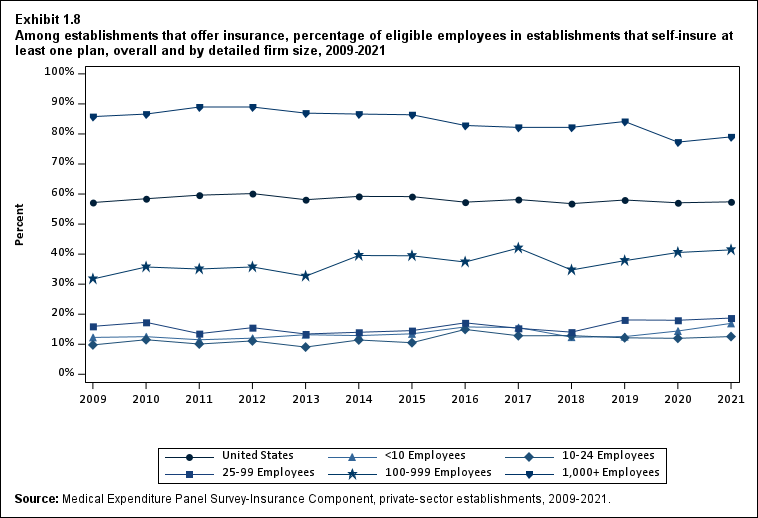
Exhibit 1.8 Among establishments that offer insurance, percentage (standard error) of eligible employees in establishments that self-insure at least one plan, overall and by detailed firm size, 2009-2021
| Number of Employees | 2009 | 2010 | 2011 | 2012 | 2013 | 2014 | 2015 | 2016 | 2017 | 2018 | 2019 | 2020 | 2021 |
|---|---|---|---|---|---|---|---|---|---|---|---|---|---|
| U.S. | 57.2% | 58.4% | 59.6% | 60.1% | 58.1%* | 59.2% | 59.1% | 57.3%* | 58.2% | 56.8% | 58.0% | 57.1% | 57.4% |
| (Standard Error) | (0.7%) | (0.7%) | (0.6%) | (0.7%) | (0.6%) | (0.6%) | (0.6%) | (0.6%) | (0.6%) | (0.6%) | (0.7%) | (0.7%) | (0.7%) |
| <10 | 12.3% | 12.5% | 11.5% | 12.0% | 13.2% | 12.9% | 13.5% | 15.7% | 15.6% | 12.4% | 12.5% | 14.4% | 16.9%^ |
| (Standard Error) | (0.6%) | (0.6%) | (0.9%) | (0.9%) | (0.8%) | (0.9%) | (1.1%) | (1.2%) | (1.3%) | (1.1%) | (1.3%) | (1.5%) | (1.8%) |
| 10-24 | 9.8% | 11.5% | 10.1% | 11.1% | 9.1% | 11.4% | 10.5% | 14.9%* | 12.8% | 12.9% | 12.1% | 12.0% | 12.6%^ |
| (Standard Error) | (0.5%) | (1.0%) | (0.8%) | (1.0%) | (0.9%) | (1.2%) | (1.1%) | (1.3%) | (1.2%) | (1.1%) | (1.3%) | (1.2%) | (1.2%) |
| 25-99 | 16.0% | 17.3% | 13.5%* | 15.5% | 13.4% | 14.0% | 14.5% | 17.1% | 15.3% | 14.0% | 18.1%* | 18.0% | 18.7%^ |
| (Standard Error) | (1.0%) | (1.1%) | (0.8%) | (0.9%) | (0.8%) | (1.1%) | (1.1%) | (1.1%) | (1.0%) | (0.9%) | (1.2%) | (1.1%) | (1.2%) |
| 100-999 | 31.7% | 35.7% | 35.0% | 35.7% | 32.6% | 39.5%* | 39.5% | 37.4% | 42.0%* | 34.7%* | 37.8% | 40.5% | 41.4%^ |
| (Standard Error) | (1.8%) | (1.4%) | (1.2%) | (1.4%) | (1.0%) | (1.4%) | (1.5%) | (1.3%) | (1.4%) | (1.3%) | (1.4%) | (1.4%) | (1.6%) |
| 1,000+ | 85.8% | 86.6% | 89.0%* | 89.0% | 86.9%* | 86.6% | 86.4% | 82.8%* | 82.2% | 82.2% | 84.1% | 77.3%* | 79.0% |
| (Standard Error) | (0.7%) | (0.6%) | (0.4%) | (0.5%) | (0.4%) | (0.7%) | (0.7%) | (0.8%) | (0.7%) | (0.9%) | (0.8%) | (1.0%) | (0.9%) |
| Source: Medical Expenditure Panel Survey-Insurance Component,
private-sector establishments, 2009-2021. Note: * indicates the estimate is statistically different from the previous year at p < 0.05. ^ indicates that the estimates for firms with <10, 10-24, 25-99, and 100-999 employees are statistically different from the estimate for firms with 1,000+ employees at p < 0.05. This test is conducted for 2021 only. |
|||||||||||||
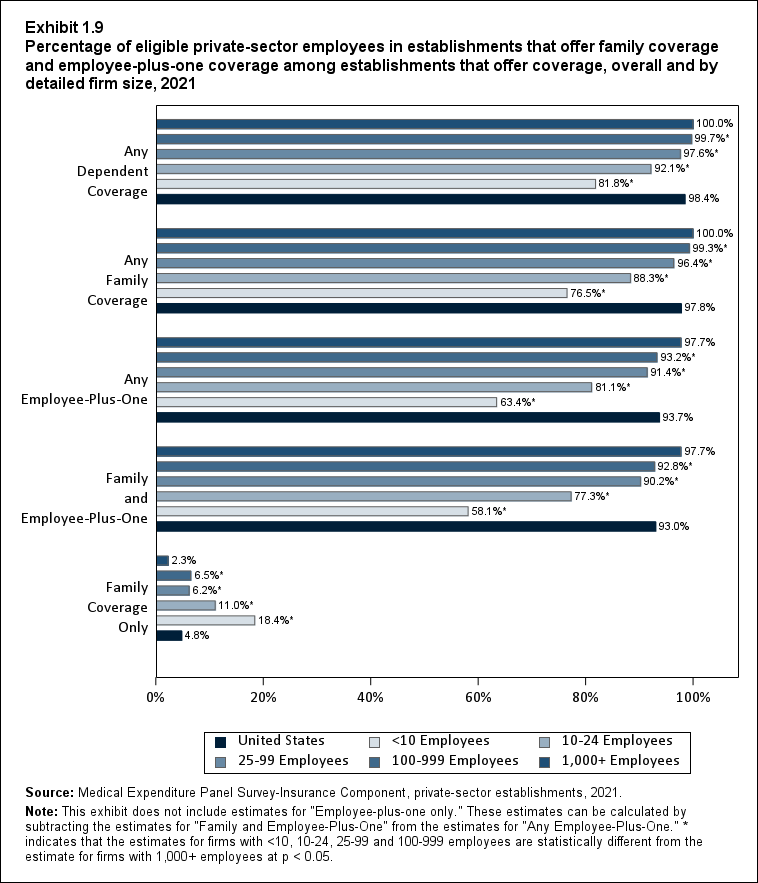
Exhibit 1.9 Percentage (standard error) of eligible private-sector employees in establishments that offer family coverage and employee-plus-one coverage among establishments that offer coverage, overall and by detailed firm size, 2021
| Coverage | United States | <10 Employees | 10-24 Employees | 25-99 Employees | 100-999 Employees | 1,000+ Employees |
|---|---|---|---|---|---|---|
| Any Dependent Coverage | 98.4% | 81.8%* | 92.1%* | 97.6%* | 99.7%* | 100.0% |
| (Standard Error) | (0.1%) | (2.0%) | (1.1%) | (0.4%) | (0.1%) | (0.0%) |
| Any Family Coverage | 97.8% | 76.5%* | 88.3%* | 96.4%* | 99.3%* | 100.0% |
| (Standard Error) | (0.1%) | (2.1%) | (1.2%) | (0.5%) | (0.2%) | (0.0%) |
| Any Employee-Plus-One | 93.7% | 63.4%* | 81.1%* | 91.4%* | 93.2%* | 97.7% |
| (Standard Error) | (0.3%) | (2.4%) | (1.6%) | (0.8%) | (0.8%) | (0.4%) |
| Family and Employee-Plus-One | 93.0% | 58.1%* | 77.3%* | 90.2%* | 92.8%* | 97.7% |
| (Standard Error) | (0.3%) | (2.4%) | (1.7%) | (0.8%) | (0.8%) | (0.4%) |
| Family Coverage Only | 4.8% | 18.4%* | 11.0%* | 6.2%* | 6.5%* | 2.3% |
| (Standard Error) | (0.3%) | (1.9%) | (1.2%) | (0.7%) | (0.8%) | (0.4%) |
| Source:Medical Expenditure Panel Survey-Insurance Component,
private-sector establishments, 2021. Note: This table does not include a row with estimates for "Employee-plus-one only." These estimates can be calculated by subtracting the estimates for "Family and Employee-Plus-One" from the estimates for "Any Employee-Plus-One." * indicates that the estimates for firms with <10, 10-24, 25-99 and 100-999 employees are statistically different from the estimate for firms with 1,000+ employees at p < 0.05. |
||||||
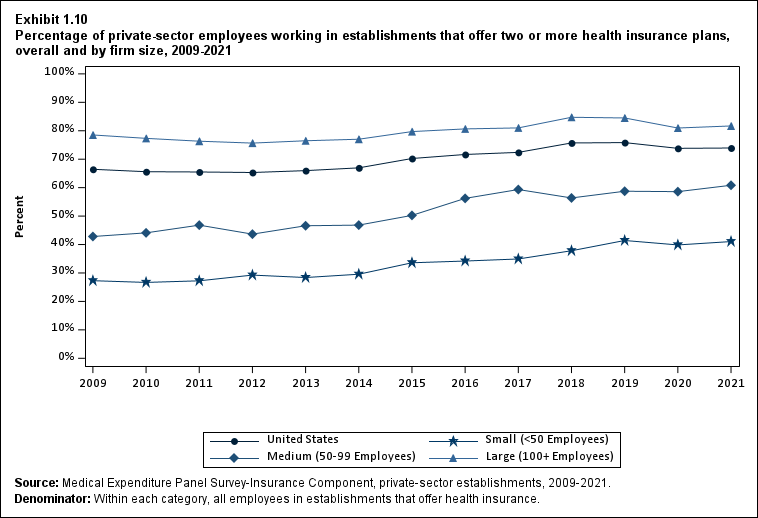
Exhibit 1.10 Percentage (standard error) of private-sector employees working in establishments that offer two or more health insurance plans, overall and by firm size, 2009-2021
| Number of Employees | 2009 | 2010 | 2011 | 2012 | 2013 | 2014 | 2015 | 2016 | 2017 | 2018 | 2019 | 2020 | 2021 |
|---|---|---|---|---|---|---|---|---|---|---|---|---|---|
| U.S. | 66.5% | 65.6% | 65.5% | 65.3% | 66.0% | 67.0% | 70.2%* | 71.7% | 72.4% | 75.7%* | 75.8% | 73.8%* | 73.9% |
| (Standard Error) | (0.7%) | (0.8%) | (0.5%) | (0.7%) | (0.6%) | (0.6%) | (0.5%) | (0.5%) | (0.5%) | (0.5%) | (0.5%) | (0.6%) | (0.6%) |
| <50 | 27.3% | 26.7% | 27.2% | 29.3% | 28.4% | 29.6% | 33.6%* | 34.2% | 34.9% | 37.8%* | 41.4%* | 39.9% | 41.0%^ |
| (Standard Error) | (0.9%) | (0.8%) | (0.9%) | (0.8%) | (1.0%) | (0.9%) | (1.1%) | (1.0%) | (1.0%) | (1.0%) | (1.1%) | (1.1%) | (1.1%) |
| 50-99 | 42.8% | 44.1% | 46.8% | 43.7% | 46.6% | 46.8% | 50.2% | 56.2%* | 59.3% | 56.4% | 58.7% | 58.6% | 60.8%^ |
| (Standard Error) | (2.0%) | (1.9%) | (2.2%) | (1.7%) | (2.2%) | (2.1%) | (2.2%) | (2.0%) | (1.9%) | (1.9%) | (2.0%) | (2.1%) | (2.2%) |
| 100+ | 78.5% | 77.3% | 76.3% | 75.7% | 76.5% | 77.0% | 79.7%* | 80.7% | 81.0% | 84.7%* | 84.5% | 81.0%* | 81.7% |
| (Standard Error) | (0.7%) | (1.0%) | (0.7%) | (0.7%) | (0.7%) | (0.6%) | (0.6%) | (0.6%) | (0.6%) | (0.5%) | (0.6%) | (0.6%) | (0.6%) |
| Source: Medical Expenditure Panel Survey-Insurance Component,
private-sector establishments, 2009-2021. Denominator: Within each category, all employees in establishments that offer health insurance. Note: * indicates the estimate is statistically different from the previous year at p < 0.05. ^ indicates that the estimates for firms with <50 and 50-99 employees are statistically different from the estimate for firms with 100+ employees at p < 0.05. This test is conducted for 2021 only. |
|||||||||||||
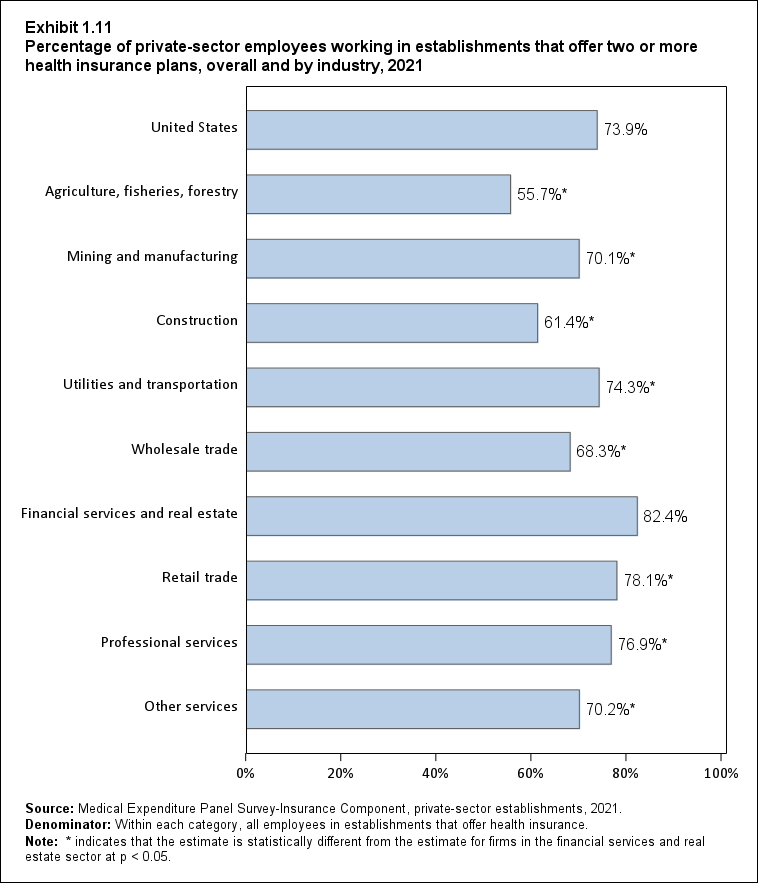
Exhibit 1.11 Percentage (standard error) of private-sector employees in establishments that offer two or more health insurance plans,overall and by industry, 2021
| Industry | Percentage |
|---|---|
| United States | 73.9% |
| (Standard Error) | (0.6%) |
| Agriculture, fisheries, forestry | 55.7%* |
| (Standard Error) | (9.4%) |
| Mining and manufacturing | 70.1%* |
| (Standard Error) | (1.7%) |
| Construction | 61.4%* |
| (Standard Error) | (2.8%) |
| Utilities and transportation | 74.3%* |
| (Standard Error) | (2.4%) |
| Wholesale trade | 68.3%* |
| (Standard Error) | (2.9%) |
| Financial services and real estate | 82.4% |
| (Standard Error) | (1.5%) |
| Retail trade | 78.1%* |
| (Standard Error) | (1.5%) |
| Professional services | 76.9%* |
| (Standard Error) | (1.0%) |
| Other services | 70.2%* |
| (Standard Error) | (1.3%) |
| Source: Medical Expenditure Panel Survey-Insurance Component,
private-sector establishments, 2009-2021. Denominator: Within each category, all employees in establishments that offer health insurance. Note: * indicates that the estimate is statistically different from the estimate for firms in the financial services and real estate sector at p < 0.05. |
|
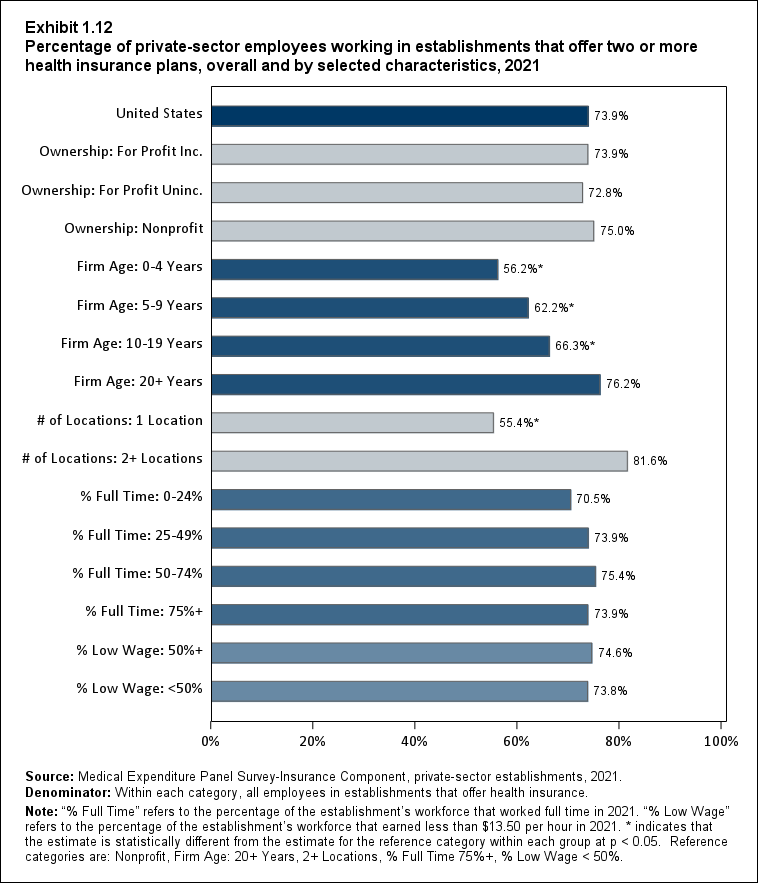
Exhibit 1.12 Percentage (standard error) of private-sector employees working in establishments that offer two or more health insurance plans, overall and by selected characteristics, 2021
| Employer Characteristics | Percentage |
|---|---|
| United States | 73.9% |
| (Standard Error) | (0.6%) |
| Ownership: For Profit Inc. | 73.9% |
| (Standard Error) | (0.7%) |
| Ownership: For Profit Uninc. | 72.8% |
| (Standard Error) | (1.4%) |
| Ownership: Nonprofit | 75.0% |
| (Standard Error) | (1.4%) |
| Firm Age: 0-4 Years | 56.2%* |
| (Standard Error) | (3.9%) |
| Firm Age: 5-9 Years | 62.2%* |
| (Standard Error) | (3.0%) |
| Firm Age: 10-19 Years | 66.3%* |
| (Standard Error) | (1.7%) |
| Firm Age: 20+ Years | 76.2% |
| (Standard Error) | (0.6%) |
| # of Locations: 1 Location | 55.4%* |
| (Standard Error) | (1.1%) |
| # of Locations: 2+ Locations | 81.6% |
| (Standard Error) | (0.6%) |
| % Full Time: 0-24% | 70.5% |
| (Standard Error) | (2.5%) |
| % Full Time: 25-49% | 73.9% |
| (Standard Error) | (1.9%) |
| % Full Time: 50-74% | 75.4% |
| (Standard Error) | (1.6%) |
| % Full Time: 75%+ | 73.9% |
| (Standard Error) | (0.6%) |
| % Low Wage: 50%+ | 74.6% |
| (Standard Error) | (1.4%) |
| % Low Wage: <50% | 73.8% |
| (Standard Error) | (0.6%) |
| Source: Medical Expenditure Panel Survey-Insurance Component,
private-sector establishments, 2021. Denominator: Within each category, employees in establishments that offer health insurance. Note: "Full Time" refers to the percentage of the establishment's workforce that worked full time in 2021. "Low Wage" refers to the percentage of the establishment's workforce that earned less than $13.50 per hour in 2021. * indicates that the estimate is statistically different from the estimate for the reference category within each group at p < 0.05. Reference categories are: Nonprofit, Firm Age: 20+ Years, 2+ Locations, % Full Time 75%+, % Low Wage < 50%. |
|
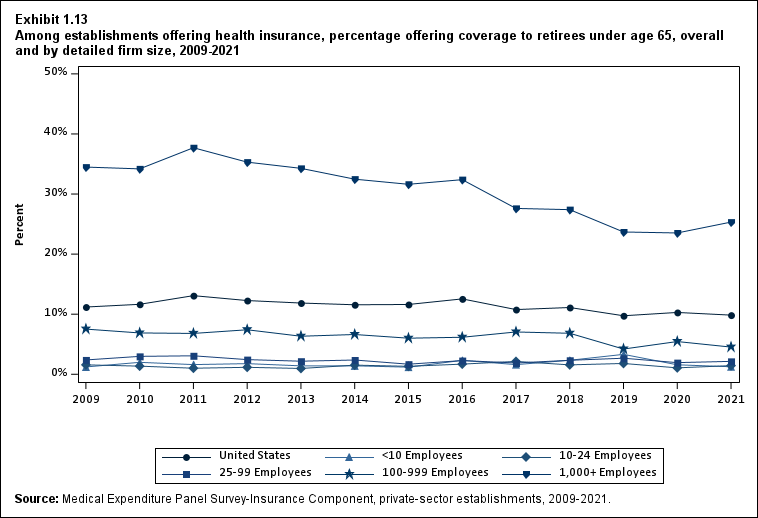
Exhibit 1.13 Among establishments offering health insurance, percentage (standard error) offering coverage to retirees under age 65, overall and by detailed firm size, 2009-2021
| Number of Employees | 2009 | 2010 | 2011 | 2012 | 2013 | 2014 | 2015 | 2016 | 2017 | 2018 | 2019 | 2020 | 2021 |
|---|---|---|---|---|---|---|---|---|---|---|---|---|---|
| U.S. | 11.2% | 11.6% | 13.1%* | 12.3% | 11.9% | 11.6% | 11.6% | 12.5% | 10.8%* | 11.1% | 9.7%* | 10.3% | 9.8% |
| (Standard Error) | (0.3%) | (0.4%) | (0.3%) | (0.3%) | (0.5%) | (0.4%) | (0.4%) | (0.4%) | (0.4%) | (0.4%) | (0.4%) | (0.5%) | (0.4%) |
| <10 | 1.2% | 2.0%* | 1.6% | 1.8% | 1.4% | 1.4% | 1.2% | 2.3% | 1.6% | 2.3% | 3.3% | 1.6% † | 1.3%^ |
| (Standard Error) | (0.2%) | (0.2%) | (0.3%) | (0.2%) | (0.2%) | (0.3%) | (0.3%) | (0.6%) | (0.4%) | (0.5%) | (0.7%) | (0.6%) | (0.3%) |
| 10-24 | 1.6% | 1.4% | 1.0% | 1.2% | 1.0% † | 1.5% | 1.3% | 1.7% | 2.1% | 1.6% | 1.8% | 1.1% † | 1.4%^ |
| (Standard Error) | (0.2%) | (0.2%) | (0.2%) | (0.2%) | (0.4%) | (0.4%) | (0.3%) | (0.4%) | (0.5%) | (0.4%) | (0.5%) | (0.3%) | (0.4%) |
| 25-99 | 2.4% | 3.0% | 3.1% | 2.4% | 2.2% | 2.4% | 1.7% | 2.3% | 1.9% | 2.3% | 2.7% | 1.9% | 2.1%^ |
| (Standard Error) | (0.4%) | (0.4%) | (0.4%) | (0.3%) | (0.3%) | (0.3%) | (0.3%) | (0.4%) | (0.3%) | (0.4%) | (0.4%) | (0.3%) | (0.4%) |
| 100-999 | 7.5% | 6.9% | 6.8% | 7.4% | 6.3% | 6.6% | 6.0% | 6.2% | 7.0% | 6.8% | 4.2%* | 5.4% | 4.5%^ |
| (Standard Error) | (0.4%) | (0.6%) | (0.2%) | (0.6%) | (0.6%) | (0.6%) | (0.6%) | (0.7%) | (0.7%) | (0.6%) | (0.5%) | (0.6%) | (0.5%) |
| 1,000+ | 34.5% | 34.2% | 37.7%* | 35.3% | 34.3% | 32.5% | 31.6% | 32.4% | 27.6%* | 27.4% | 23.7%* | 23.5% | 25.3% |
| (Standard Error) | (1.2%) | (1.3%) | (0.9%) | (1.1%) | (0.9%) | (1.2%) | (1.1%) | (1.0%) | (1.0%) | (1.0%) | (1.0%) | (1.1%) | (1.1%) |
| † Estimate does not meet standard of reliability or precision. Source: Medical Expenditure Panel Survey-Insurance Component, private-sector establishments, 2009-2021. Note: * indicates the estimate is statistically different from the previous year at p < 0.05. ^ indicates that the estimates for firms with <10, 10-24, 25-99, and 100-999 employees are statistically different from the estimate for firms with 1,000+ employees at p < 0.05. This test is conducted for 2021 only. |
|||||||||||||
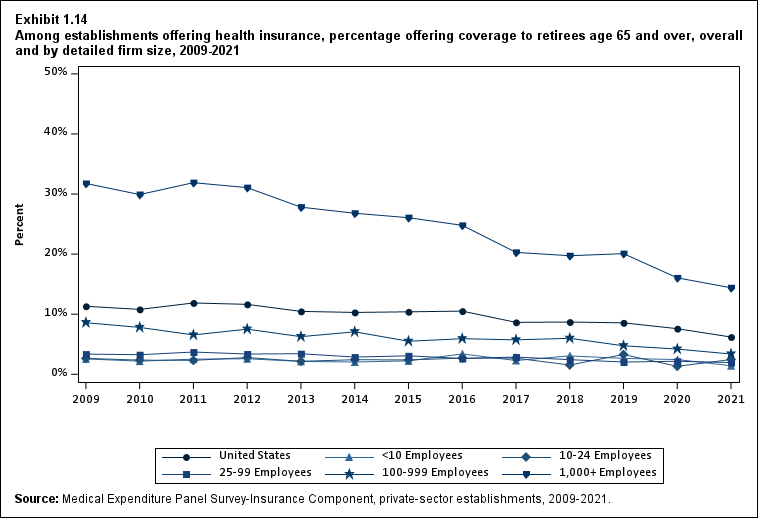
Exhibit 1.14 Among establishments offering health insurance, percentage (standard error) offering coverage to retirees age 65 and over, overall and by detailed firm size, 2009-2021
| Number of Employees | 2009 | 2010 | 2011 | 2012 | 2013 | 2014 | 2015 | 2016 | 2017 | 2018 | 2019 | 2020 | 2021 |
|---|---|---|---|---|---|---|---|---|---|---|---|---|---|
| U.S. | 11.3% | 10.8% | 11.9%* | 11.6% | 10.5%* | 10.3% | 10.4% | 10.5% | 8.6%* | 8.7% | 8.6% | 7.6% | 6.2%* |
| (Standard Error) | (0.3%) | (0.4%) | (0.3%) | (0.4%) | (0.4%) | (0.4%) | (0.4%) | (0.4%) | (0.4%) | (0.4%) | (0.4%) | (0.4%) | (0.4%) |
| <10 | 2.6% | 2.2% | 2.5% | 2.6% | 2.1% | 2.0% | 2.2% | 3.4% | 2.3% | 3.1% | 2.6% | 2.4% | 1.4%^ |
| (Standard Error) | (0.3%) | (0.3%) | (0.2%) | (0.3%) | (0.4%) | (0.3%) | (0.4%) | (0.7%) | (0.5%) | (0.6%) | (0.7%) | (0.6%) | (0.4%) |
| 10-24 | 2.7% | 2.3% | 2.3% | 2.8% | 2.2% | 2.4% | 2.4% | 2.7% | 2.7% | 1.5% | 3.3%* | 1.3%* | 2.5%^ |
| (Standard Error) | (0.3%) | (0.5%) | (0.4%) | (0.5%) | (0.6%) | (0.5%) | (0.5%) | (0.5%) | (0.5%) | (0.4%) | (0.6%) | (0.4%) | (0.6%) |
| 25-99 | 3.4% | 3.3% | 3.7% | 3.4% | 3.4% | 2.9% | 3.1% | 2.6% | 2.9% | 2.4% | 2.0% | 2.2% | 1.9%^ |
| (Standard Error) | (0.2%) | (0.3%) | (0.4%) | (0.3%) | (0.4%) | (0.4%) | (0.5%) | (0.4%) | (0.4%) | (0.4%) | (0.3%) | (0.3%) | (0.4%) |
| 100-999 | 8.6% | 7.8% | 6.5%* | 7.5% | 6.3% | 7.1% | 5.5% | 5.9% | 5.7% | 6.0% | 4.7% | 4.2% | 3.4%^ |
| (Standard Error) | (0.4%) | (0.4%) | (0.4%) | (0.8%) | (0.7%) | (0.6%) | (0.6%) | (0.7%) | (0.6%) | (0.6%) | (0.5%) | (0.5%) | (0.5%) |
| 1,000+ | 31.8% | 29.9% | 31.9% | 31.1% | 27.8%* | 26.8% | 26.1% | 24.8% | 20.3%* | 19.7% | 20.1% | 16.1%* | 14.4% |
| (Standard Error) | (1.0%) | (1.1%) | (0.9%) | (1.4%) | (0.7%) | (1.2%) | (1.1%) | (1.0%) | (0.9%) | (0.9%) | (1.0%) | (0.9%) | (0.9%) |
| Source: Medical Expenditure Panel Survey-Insurance Component,
private-sector establishments, 2009-2021. Note: * indicates the estimate is statistically different from the previous year at p < 0.05. ^ indicates that the estimates for firms with <10, 10-24, 25-99, and 100-999 employees are statistically different from the estimate for firms with 1,000+ employees at p < 0.05. This test is conducted for 2021 only. |
|||||||||||||
Section 2: Employee Eligibility and Enrollment
The share of employees enrolled in a health plan through their employer is determined by the establishment offer rate (described in Section 1), the share of employees eligible for coverage at establishments that offer insurance (the "eligibility rate"), and the share of eligible employees who enroll in coverage (the "take-up rate"). Factors such as the share of workers who are part time or who are low wage can affect eligibility and take-up rates.
This section presents estimates for 2009 to 2021 for private-sector employees for the:
- Enrollment rate (the percentage of all employees enrolled in their employer's health insurance plan regardless of whether the establishment offered health insurance). The enrollment rate is calculated by multiplying offer, eligibility, and take-up rates. In this calculation, the enrollment rate is equal to zero at employers that do not offer coverage;
- Coverage rate (the percentage of all employees enrolled in their employer's health insurance plan at establishments that offered health insurance). The coverage rate is equal to the eligibility rate multiplied by the take-up rate;
- Eligibility rate (the percentage of employees eligible for health insurance through their employer at establishments offering health insurance); and
- Take-up rate (the percentage of eligible employees who enrolled in their employer's health insurance).
This section also presents estimates for 2009 to 2021 for the percentage of enrollees in single, employee-plus-one, and family coverage and examines variation in coverage, eligibility, and take-up rates by firm size, firm age, industry, ownership status, number of locations, percent full-time workers, and percent low-wage workers. Finally, this section presents coverage rates by the State in which the establishment was located.
Highlights
- From 2020 to 2021, there were no statistically significant changes in enrollment rates for small (fewer than 50 employees), medium (50 to 99 employees), or large firms (100 or more employees). The overall enrollment rate fell from 49.5 percent in 2020 to 48.0 percent in 2021 (Exhibit 2.1). However, this reduction in the overall enrollment rate is not accompanied by a reduction in the total number of employees enrolled in employer-sponsored health insurance (Exhibit 2.2).
- There were no statistically significant changes from 2020 to 2021 in the eligibility rate for employees at private-sector establishments overall or for employees of small, medium, or large firms. The overall 2021 eligibility rate of 80.3 percent remains elevated relative to the 2019 eligibility rate of 77.7 percent (Exhibit 2.4).
- Among medium employers, take-up rates fell from 68.8 to 64.7 percent (Exhibit 2.5). As in 2020, the overall take-up rate in 2021 remained lower than in 2019.
- Across the Nation, nine States had coverage rates above the national average of 56.3 percent, ranging from 58.6 percent in Texas to 64.5 percent in Washington. Eight States had coverage rates below the national average, ranging from 50.4 percent in New York to 53.4 percent in Vermont (Exhibit 2.9).
Key Trends and Differences
Enrollment rates were lower at small and medium firms, compared with large firms, reflecting lower offer rates (presented in Section 1). Coverage, eligibility, and take-up rates were lower among younger firms, firms with one location (versus multiple locations), firms with fewer full-time workers, and firms with 50 percent or more low-wage workers.
For both small employers (firms with fewer than 50 workers) and large employers (firms with 50 or more workers), coverage, eligibility, and take-up rates were substantially lower at firms with 50 percent or more low-wage workers compared with firms with less than 50 percent low-wage workers. Continuing a longstanding pattern, in 2021, a lower percentage of enrollees in large firms compared with small and medium firms chose single coverage, while a higher percentage of large-firm enrollees chose employee-plus-one coverage or family coverage.
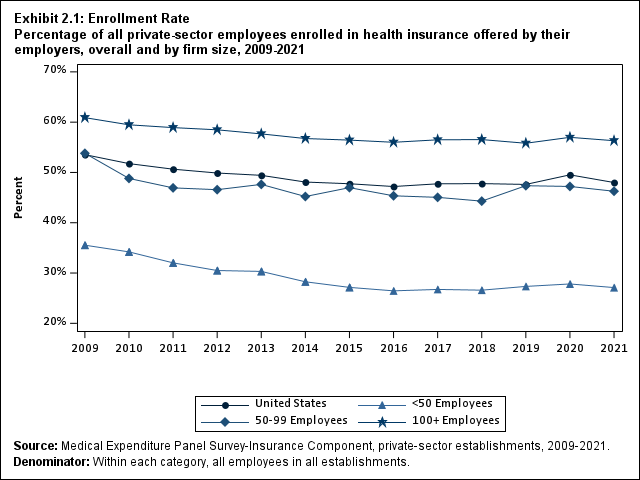
Exhibit 2.1: Enrollment Rate Percentage (standard error) of all private-sector employees enrolled in health insurance offered by their employers, overall and by firm size, 2009-2021
| Number of Employees | 2009 | 2010 | 2011 | 2012 | 2013 | 2014 | 2015 | 2016 | 2017 | 2018 | 2019 | 2020 | 2021 |
|---|---|---|---|---|---|---|---|---|---|---|---|---|---|
| U.S. | 53.5% | 51.8%* | 50.6% | 49.9% | 49.4% | 48.1%* | 47.8% | 47.2% | 47.7% | 47.8% | 47.6% | 49.5%* | 48.0%* |
| (Standard Error) | (0.4%) | (0.5%) | (0.3%) | (0.3%) | (0.3%) | (0.3%) | (0.4%) | (0.3%) | (0.4%) | (0.4%) | (0.4%) | (0.4%) | (0.4%) |
| <50 | 35.5% | 34.2% | 32.0%* | 30.5%* | 30.3% | 28.3%* | 27.1% | 26.5% | 26.7% | 26.6% | 27.3% | 27.8% | 27.1%^ |
| (Standard Error) | (0.4%) | (0.6%) | (0.4%) | (0.3%) | (0.4%) | (0.4%) | (0.5%) | (0.4%) | (0.4%) | (0.4%) | (0.5%) | (0.5%) | (0.5%) |
| 50-99 | 53.8% | 48.8%* | 46.9% | 46.6% | 47.6% | 45.2% | 47.0% | 45.4% | 45.0% | 44.3% | 47.4% | 47.2% | 46.3%^ |
| (Standard Error) | (1.1%) | (1.0%) | (1.2%) | (0.7%) | (0.7%) | (1.3%) | (1.3%) | (1.2%) | (1.2%) | (1.2%) | (1.2%) | (1.3%) | (1.3%) |
| 100+ | 60.9% | 59.5% | 58.9% | 58.5% | 57.7% | 56.7% | 56.4% | 56.0% | 56.5% | 56.5% | 55.8% | 57.0% | 56.3% |
| (Standard Error) | (0.6%) | (0.6%) | (0.4%) | (0.4%) | (0.3%) | (0.5%) | (0.5%) | (0.5%) | (0.5%) | (0.5%) | (0.6%) | (0.5%) | (0.5%) |
| Source: Medical Expenditure Panel Survey-Insurance Component,
private-sector establishments, 2009-2021. Denominator: Within each category, all employees in all establishments. Note: * indicates the estimate is statistically different from the previous year at p < 0.05. ^ indicates that the estimates for firms with <50 and 50-99 employees are statistically different from the estimate for firms with 100+ employees at p < 0.05. This test is conducted for 2021 only. |
|||||||||||||
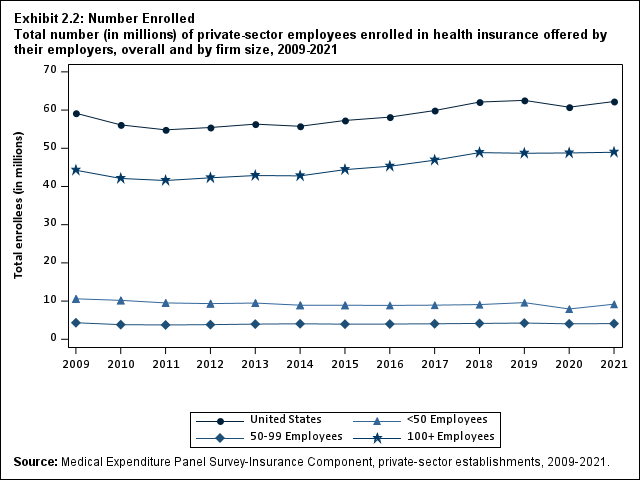
Exhibit 2.2: Number Enrolled Total number (in millions) (standard error) of private-sector employees enrolled in health insurance offered by their employers, overall and by firm size, 2009-2021
| Number of Employees | 2009 | 2010 | 2011 | 2012 | 2013 | 2014 | 2015 | 2016 | 2017 | 2018 | 2019 | 2020 | 2021 |
|---|---|---|---|---|---|---|---|---|---|---|---|---|---|
| U.S. | 59.2 | 56.1* | 54.8 | 55.4 | 56.3 | 55.8 | 57.3 | 58.2 | 59.9 | 62.1* | 62.5 | 60.8 | 62.2 |
| (Standard Error) | (0.7) | (0.8) | (0.6) | (0.6) | (0.7) | (0.6) | (0.6) | (0.6) | (0.7) | (0.7) | (0.9) | (0.7) | (0.7) |
| <50 | 10.6 | 10.2 | 9.5* | 9.3 | 9.5 | 8.9* | 8.9 | 8.9 | 8.9 | 9.1 | 9.6* | 7.9* | 9.2*^ |
| (Standard Error) | (0.2) | (0.2) | (0.1) | (0.1) | (0.2) | (0.1) | (0.1) | (0.1) | (0.1) | (0.1) | (0.2) | (0.1) | (0.2) |
| 50-99 | 4.3 | 3.8* | 3.7 | 3.8 | 4.0 | 4.1 | 4.0 | 4.0 | 4.1 | 4.2 | 4.2 | 4.0 | 4.1^ |
| (Standard Error) | (0.1) | (0.2) | (0.1) | (0.2) | (0.2) | (0.1) | (0.2) | (0.1) | (0.2) | (0.2) | (0.2) | (0.2) | (0.2) |
| 100+ | 44.3 | 42.1* | 41.6 | 42.3 | 42.9 | 42.8 | 44.4* | 45.3 | 46.9 | 48.9* | 48.7 | 48.8 | 49.0 |
| (Standard Error) | (0.6) | (0.8) | (0.5) | (0.6) | (0.7) | (0.6) | (0.6) | (0.6) | (0.7) | (0.7) | (0.8) | (0.7) | (0.7) |
| Source: Medical Expenditure Panel Survey-Insurance Component,
private-sector establishments, 2009-2021. Note: The sum of estimates by firm size may differ from the U.S. total due to rounding. * indicates the estimate is statistically different from the previous year at p < 0.05. ^ indicates that the estimates for firms with <50 and 50-99 employees are statistically different from the estimate for firms with 100+ employees at p < 0.05. This test is conducted for 2021 only. |
|||||||||||||
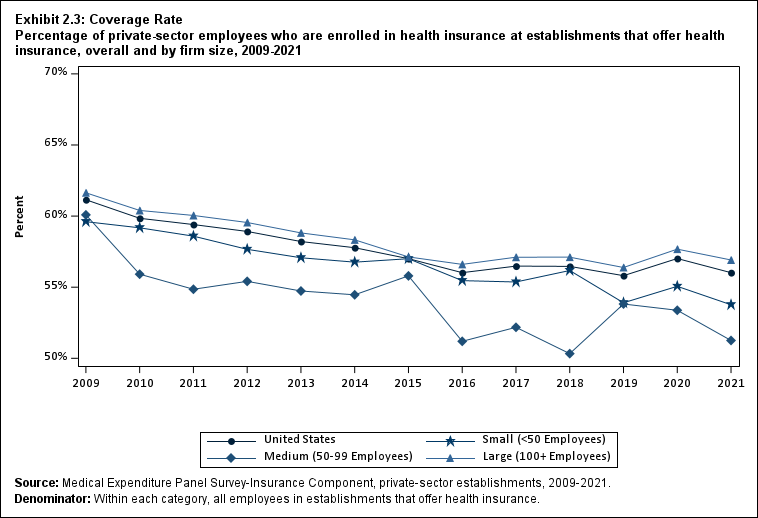
Exhibit 2.3: Coverage Rate Percentage (standard error) of private-sector employees who are enrolled in health insurance at establishments that offer health insurance, overall and by firm size, 2009-2021
| Number of Employees | 2009 | 2010 | 2011 | 2012 | 2013 | 2014 | 2015 | 2016 | 2017 | 2018 | 2019 | 2020 | 2021 |
|---|---|---|---|---|---|---|---|---|---|---|---|---|---|
| U.S. | 61.1% | 59.8%* | 59.4% | 58.9% | 58.2% | 57.8% | 57.0% | 56.0% | 56.5% | 56.5% | 55.8% | 57.0% | 56.0% |
| (Standard Error) | (0.4%) | (0.5%) | (0.2%) | (0.4%) | (0.3%) | (0.4%) | (0.4%) | (0.4%) | (0.4%) | (0.4%) | (0.5%) | (0.4%) | (0.4%) |
| <50 | 59.6% | 59.2% | 58.6% | 57.7% | 57.1% | 56.8% | 57.0% | 55.5% | 55.4% | 56.2% | 53.9%* | 55.1% | 53.8%^ |
| (Standard Error) | (0.4%) | (0.6%) | (0.5%) | (0.5%) | (0.5%) | (0.6%) | (0.6%) | (0.6%) | (0.6%) | (0.6%) | (0.6%) | (0.7%) | (0.7%) |
| 50-99 | 60.1% | 55.9%* | 54.9% | 55.4% | 54.7% | 54.5% | 55.8% | 51.2%* | 52.2% | 50.3% | 53.8%* | 53.4% | 51.3%^ |
| (Standard Error) | (1.0%) | (0.8%) | (1.0%) | (1.2%) | (0.8%) | (1.3%) | (1.2%) | (1.2%) | (1.2%) | (1.2%) | (1.2%) | (1.3%) | (1.3%) |
| 100+ | 61.6% | 60.4% | 60.0% | 59.5% | 58.8% | 58.3% | 57.1% | 56.6% | 57.1% | 57.1% | 56.4% | 57.7% | 56.9% |
| (Standard Error) | (0.6%) | (0.6%) | (0.3%) | (0.4%) | (0.3%) | (0.5%) | (0.5%) | (0.5%) | (0.5%) | (0.5%) | (0.6%) | (0.5%) | (0.5%) |
| Source: Medical Expenditure Panel Survey-Insurance Component,
private-sector establishments, 2009-2021. Denominator: Within each category, all employees in establishments that offer health insurance. Note: * indicates the estimate is statistically different from the previous year at p < 0.05. ^ indicates that the estimates for firms with <50 and 50-99 employees are statistically different from the estimate for firms with 100+ employees at p < 0.05. This test is conducted for 2021 only. |
|||||||||||||
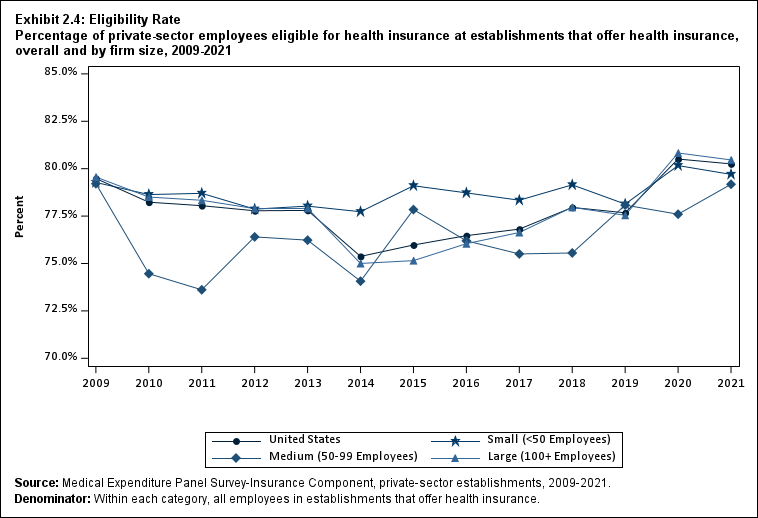
Exhibit 2.4: Eligibility Rate Percentage (standard error) of private-sector employees eligible for health insurance at establishments that offer health insurance, overall and by firm size, 2009-2021
| Number of Employees | 2009 | 2010 | 2011 | 2012 | 2013 | 2014 | 2015 | 2016 | 2017 | 2018 | 2019 | 2020 | 2021 |
|---|---|---|---|---|---|---|---|---|---|---|---|---|---|
| U.S. | 79.5% | 78.2%* | 78.0% | 77.8% | 77.8% | 75.4%* | 76.0% | 76.5% | 76.8% | 78.0%* | 77.7% | 80.5%* | 80.3% |
| (Standard Error) | (0.3%) | (0.5%) | (0.4%) | (0.3%) | (0.2%) | (0.4%) | (0.4%) | (0.4%) | (0.4%) | (0.4%) | (0.4%) | (0.4%) | (0.4%) |
| <50 | 79.3% | 78.6% | 78.7% | 77.9% | 78.0% | 77.7% | 79.1% | 78.7% | 78.3% | 79.1% | 78.1% | 80.2%* | 79.7% |
| (Standard Error) | (0.5%) | (0.5%) | (0.6%) | (0.5%) | (0.4%) | (0.6%) | (0.6%) | (0.6%) | (0.6%) | (0.6%) | (0.6%) | (0.6%) | (0.6%) |
| 50-99 | 79.2% | 74.5%* | 73.6% | 76.4% | 76.2% | 74.1% | 77.8%* | 76.2% | 75.5% | 75.6% | 78.1% | 77.6% | 79.2% |
| (Standard Error) | (0.8%) | (0.6%) | (1.0%) | (1.2%) | (0.8%) | (1.4%) | (1.2%) | (1.2%) | (1.2%) | (1.2%) | (1.2%) | (1.4%) | (1.3%) |
| 100+ | 79.6% | 78.5% | 78.3% | 77.9% | 77.9% | 75.0%* | 75.2% | 76.0% | 76.6% | 78.0% | 77.5% | 80.8%* | 80.5% |
| (Standard Error) | (0.5%) | (0.6%) | (0.4%) | (0.3%) | (0.3%) | (0.5%) | (0.5%) | (0.4%) | (0.5%) | (0.5%) | (0.5%) | (0.5%) | (0.4%) |
| Source: Medical Expenditure Panel Survey-Insurance Component,
private-sector establishments, 2009-2021. Denominator: Within each category, all employees in establishments that offer health insurance. Note: * indicates the estimate is statistically different from the previous year at p < 0.05. ^ indicates that the estimates for firms with <50 and 50-99 employees are statistically different from the estimate for firms with 100+ employees at p < 0.05. This test is conducted for 2021 only. |
|||||||||||||
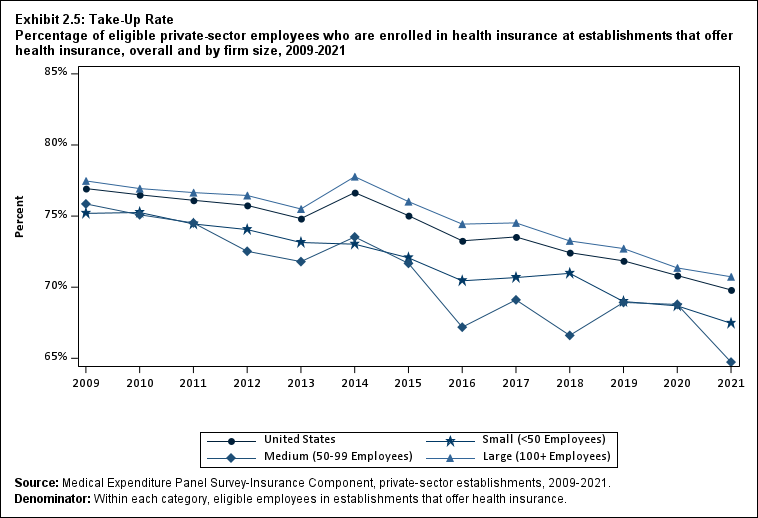
Exhibit 2.5: Take-Up Rate Percentage (standard error) of eligible private-sector employees who are enrolled in health insurance at establishments that offer health insurance, overall and by firm size, 2009-2021
| Number of Employees | 2009 | 2010 | 2011 | 2012 | 2013 | 2014 | 2015 | 2016 | 2017 | 2018 | 2019 | 2020 | 2021 |
|---|---|---|---|---|---|---|---|---|---|---|---|---|---|
| U.S. | 76.9% | 76.5% | 76.1% | 75.8% | 74.8%* | 76.7%* | 75.0%* | 73.3%* | 73.5% | 72.4%* | 71.9% | 70.8%* | 69.8% |
| (Standard Error) | (0.3%) | (0.2%) | (0.3%) | (0.3%) | (0.2%) | (0.3%) | (0.3%) | (0.3%) | (0.3%) | (0.4%) | (0.4%) | (0.4%) | (0.4%) |
| <50 | 75.2% | 75.3% | 74.4% | 74.1% | 73.1% | 73.0% | 72.1% | 70.4%* | 70.7% | 71.0% | 69.0%* | 68.7% | 67.5%^ |
| (Standard Error) | (0.3%) | (0.6%) | (0.4%) | (0.4%) | (0.6%) | (0.5%) | (0.5%) | (0.5%) | (0.6%) | (0.6%) | (0.6%) | (0.6%) | (0.7%) |
| 50-99 | 75.9% | 75.1% | 74.5% | 72.5% | 71.8% | 73.5% | 71.7% | 67.2%* | 69.1% | 66.6% | 68.9% | 68.8% | 64.7%*^ |
| (Standard Error) | (0.9%) | (0.7%) | (0.6%) | (0.8%) | (1.0%) | (1.0%) | (1.1%) | (1.2%) | (1.1%) | (1.1%) | (1.0%) | (1.0%) | (1.2%) |
| 100+ | 77.5% | 76.9% | 76.7% | 76.4% | 75.5%* | 77.8%* | 76.0%* | 74.4%* | 74.5% | 73.3%* | 72.7% | 71.4%* | 70.7% |
| (Standard Error) | (0.5%) | (0.3%) | (0.3%) | (0.4%) | (0.3%) | (0.3%) | (0.3%) | (0.4%) | (0.4%) | (0.4%) | (0.5%) | (0.4%) | (0.5%) |
| Source: Medical Expenditure Panel Survey-Insurance Component,
private-sector establishments, 2009-2021. Denominator: Within each category, all employees in establishments that offer health insurance. Note: * indicates the estimate is statistically different from the previous year at p < 0.05. ^ indicates that the estimates for firms with <50 and 50-99 employees are statistically different from the estimate for firms with 100+ employees at p < 0.05. This test is conducted for 2021 only. |
|||||||||||||
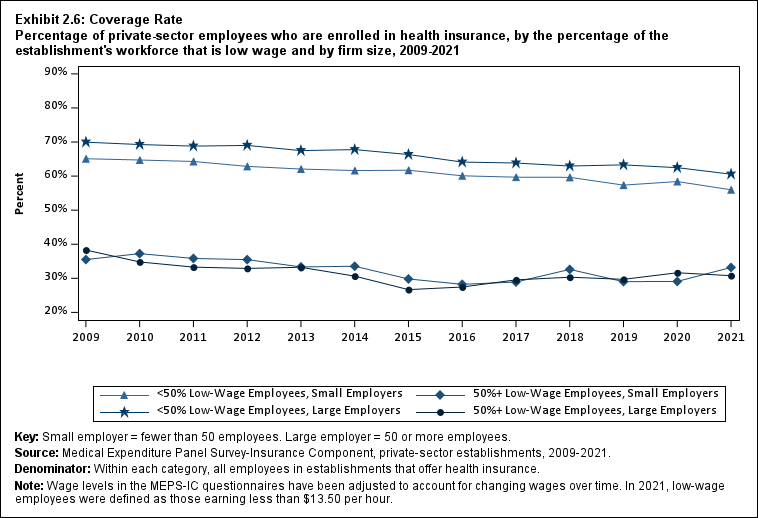
Exhibit 2.6: Coverage Rate Percentage (standard error) of private-sector employees who are enrolled in health insurance, by the percentage of the establishment's workforce that is low wage and by firm size, 2009-2021
| Low Wage | 2009 | 2010 | 2011 | 2012 | 2013 | 2014 | 2015 | 2016 | 2017 | 2018 | 2019 | 2020 | 2021 |
|---|---|---|---|---|---|---|---|---|---|---|---|---|---|
| <50% Low-Wage Employees, Small Employers | 65.1% | 64.7% | 64.3% | 62.9%* | 62.1% | 61.6% | 61.7% | 60.1%* | 59.7% | 59.6% | 57.4%* | 58.4% | 56.0%* |
| (Standard Error) | (0.4%) | (0.6%) | (0.4%) | (0.5%) | (0.4%) | (0.6%) | (0.6%) | (0.6%) | (0.6%) | (0.6%) | (0.6%) | (0.7%) | (0.8%) |
| 50%+ Low-Wage Employees, Small Employers | 35.5% | 37.2% | 35.8% | 35.5% | 33.3% | 33.5% | 29.8% | 28.2% | 28.9% | 32.6% | 29.0% | 29.1% | 33.2%^ |
| (Standard Error) | (0.7%) | (0.8%) | (0.6%) | (0.6%) | (1.2%) | (1.5%) | (1.4%) | (1.3%) | (1.3%) | (1.5%) | (1.6%) | (1.6%) | (1.8%) |
| <50% Low-Wage Employees, Large Employers | 70.0% | 69.3% | 68.8% | 69.0% | 67.5%* | 67.8% | 66.3%* | 64.1%* | 63.8% | 63.0% | 63.3% | 62.5% | 60.6%* |
| (Standard Error) | (0.5%) | (0.6%) | (0.4%) | (0.5%) | (0.4%) | (0.4%) | (0.5%) | (0.5%) | (0.5%) | (0.5%) | (0.6%) | (0.5%) | (0.5%) |
| 50%+ Low-Wage Employees, Large Employers | 38.3% | 34.8%* | 33.3% | 32.9% | 33.2% | 30.6%* | 26.7%* | 27.4% | 29.5%* | 30.3% | 29.7% | 31.6% | 30.8%^ |
| (Standard Error) | (0.8%) | (0.9%) | (0.6%) | (0.6%) | (0.6%) | (0.7%) | (0.7%) | (0.7%) | (0.7%) | (0.9%) | (0.9%) | (0.9%) | (1.0%) |
| Key: Small employer = fewer than 50 employees. Large employer = 50
or more employees. Source: Medical Expenditure Panel Survey-Insurance Component, private-sector establishments, 2009-2021. Denominator: Within each category, all employees in establishments that offer health insurance. Note: Wage levels in the MEPS-IC questionnaires have been adjusted to account for changing wages over time. In 2021, low-wage employees were defined as those earning less than $13.50 per hour. * indicates the estimate is statistically different from the previous year at p < 0.05. ^ indicates that the estimates for small (large) employers with 50%+ low wage employees are statistically different from the estimate for small (large) employers with < 50 percent low wage employees at p < 0.05. This test is conducted for 2021 only. |
|||||||||||||
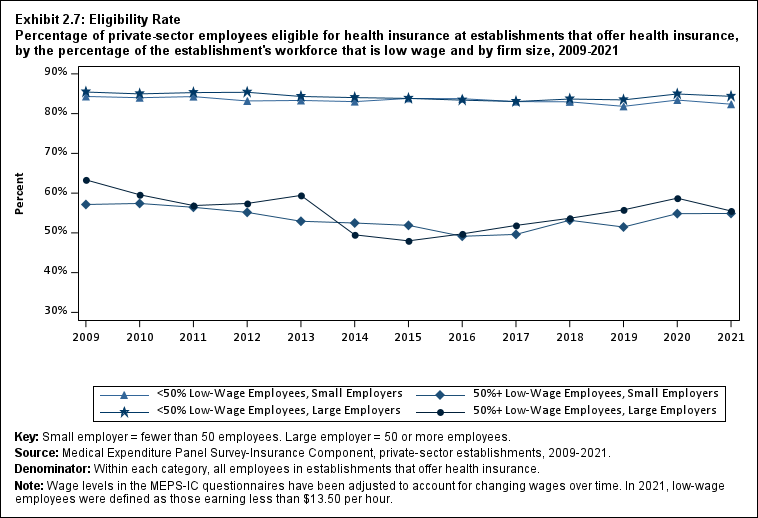
Exhibit 2.7: Eligibility Rate Percentage of private-sector employees eligible for health insurance at establishments that offer health insurance, by the percentage of the establishment's workforce that is low wage and by firm size, 2009-2021
| Low Wage | 2009 | 2010 | 2011 | 2012 | 2013 | 2014 | 2015 | 2016 | 2017 | 2018 | 2019 | 2020 | 2021 |
|---|---|---|---|---|---|---|---|---|---|---|---|---|---|
| <50% Low-Wage Employees, Small Employers | 84.3% | 84.0% | 84.3% | 83.2% | 83.3% | 83.0% | 83.8% | 83.8% | 83.0% | 83.0% | 81.8% | 83.4% | 82.4% |
| (Standard Error) | (0.3%) | (0.5%) | (0.4%) | (0.6%) | (0.4%) | (0.5%) | (0.5%) | (0.5%) | (0.5%) | (0.6%) | (0.6%) | (0.6%) | (0.6%) |
| 50%+ Low-Wage Employees, Small Employers | 57.1% | 57.4% | 56.4% | 55.2% | 52.9% | 52.5% | 51.9% | 49.1% | 49.6% | 53.2% | 51.5% | 54.8% | 54.9%^ |
| (Standard Error) | (1.0%) | (1.0%) | (1.3%) | (1.0%) | (1.5%) | (1.8%) | (1.9%) | (2.0%) | (1.8%) | (1.9%) | (2.3%) | (2.2%) | (2.2%) |
| <50% Low-Wage Employees, Large Employers | 85.4% | 85.0% | 85.3% | 85.4% | 84.3%* | 84.0% | 83.8% | 83.4% | 83.0% | 83.7% | 83.5% | 84.9%* | 84.4% |
| (Standard Error) | (0.5%) | (0.7%) | (0.5%) | (0.4%) | (0.3%) | (0.4%) | (0.4%) | (0.4%) | (0.5%) | (0.5%) | (0.5%) | (0.5%) | (0.4%) |
| 50%+ Low-Wage Employees, Large Employers | 63.3% | 59.6%* | 56.9%* | 57.4% | 59.4%* | 49.5%* | 48.0% | 49.7% | 51.9% | 53.7% | 55.8% | 58.7% | 55.5%*^ |
| (Standard Error) | (0.9%) | (0.8%) | (1.0%) | (0.5%) | (0.6%) | (0.9%) | (0.9%) | (0.9%) | (0.9%) | (1.1%) | (1.1%) | (1.1%) | (1.2%) |
| Key: Small employer = fewer than 50 employees. Large employer = 50
or more employees. Source: Medical Expenditure Panel Survey-Insurance Component, private-sector establishments, 2009-2021. Denominator: Within each category, all employees in establishments that offer health insurance. Note: Wage levels in the MEPS-IC questionnaires have been adjusted to account for changing wages over time. In 2021, low-wage employees were defined as those earning less than $13.50 per hour. * indicates the estimate is statistically different from the previous year at p < 0.05. ^ indicates that the estimates for small (large) employers with 50%+ low wage employees are statistically different from the estimate for small (large) employers with < 50 percent low wage employees at p < 0.05. This test is conducted for 2021 only. |
|||||||||||||
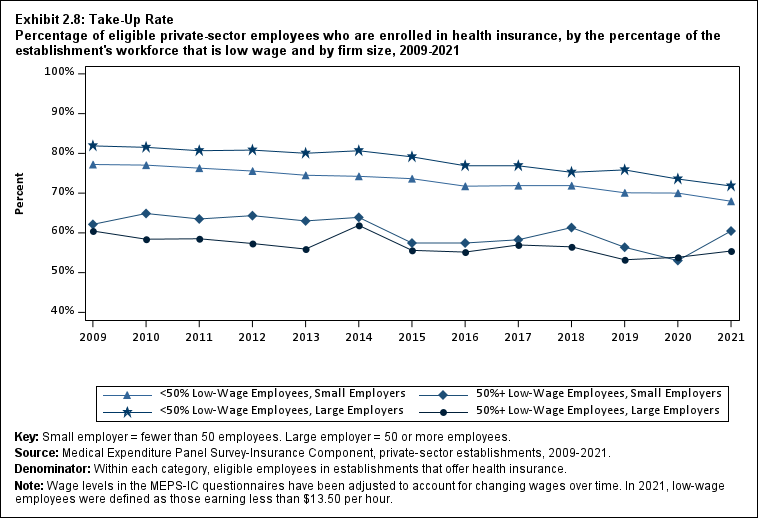
Exhibit 2.8: Take-Up Rate Percentage (standard error) of eligible private-sector employees who are enrolled in health insurance, by the percentage of the establishment's workforce that is low wage and by firm size, 2009-2021
| Low Wage | 2009 | 2010 | 2011 | 2012 | 2013 | 2014 | 2015 | 2016 | 2017 | 2018 | 2019 | 2020 | 2021 |
|---|---|---|---|---|---|---|---|---|---|---|---|---|---|
| <50% Low-Wage Employees, Small Employers | 77.2% | 77.0% | 76.3% | 75.6% | 74.5%* | 74.2% | 73.6% | 71.7%* | 71.9% | 71.9% | 70.1%* | 70.0% | 68.0%* |
| (Standard Error) | (0.4%) | (0.5%) | (0.4%) | (0.2%) | (0.5%) | (0.5%) | (0.5%) | (0.6%) | (0.5%) | (0.6%) | (0.6%) | (0.7%) | (0.7%) |
| 50%+ Low-Wage Employees, Small Employers | 62.1% | 64.9% | 63.5% | 64.3% | 63.0% | 63.9% | 57.4%* | 57.5% | 58.3% | 61.3% | 56.4% | 53.0% | 60.5%*^ |
| (Standard Error) | (1.3%) | (1.2%) | (1.1%) | (1.7%) | (1.9%) | (2.1%) | (2.2%) | (2.1%) | (2.3%) | (2.2%) | (2.2%) | (2.3%) | (2.7%) |
| <50% Low-Wage Employees, Large Employers | 81.9% | 81.5% | 80.7% | 80.8% | 80.0% | 80.7% | 79.1%* | 76.9%* | 76.9% | 75.2%* | 75.8% | 73.6%* | 71.8%* |
| (Standard Error) | (0.4%) | (0.3%) | (0.4%) | (0.3%) | (0.3%) | (0.3%) | (0.3%) | (0.4%) | (0.4%) | (0.4%) | (0.4%) | (0.4%) | (0.5%) |
| 50%+ Low-Wage Employees, Large Employers | 60.5% | 58.4% | 58.5% | 57.3% | 55.9% | 61.9%* | 55.6%* | 55.2% | 57.0% | 56.5% | 53.2% | 53.9% | 55.4%^ |
| (Standard Error) | (0.9%) | (1.0%) | (0.8%) | (1.1%) | (0.5%) | (0.8%) | (1.0%) | (1.0%) | (1.0%) | (1.2%) | (1.2%) | (1.2%) | (1.3%) |
| Key: Small employer = fewer than 50 employees. Large employer = 50
or more employees. Source: Medical Expenditure Panel Survey-Insurance Component, private-sector establishments, 2009-2021. Denominator: Within each category, eligible employees in establishments that offer health insurance. Note: Wage levels in the MEPS-IC questionnaires have been adjusted to account for changing wages over time. In 2021, low-wage employees were defined as those earning less than $13.50 per hour. * indicates the estimate is statistically different from the previous year at p < 0.05. ^ indicates that the estimates for small (large) employers with 50%+ low wage employees are statistically different from the estimate for small (large) employers with < 50 percent low wage employees at p < 0.05. This test is conducted for 2021 only. |
|||||||||||||
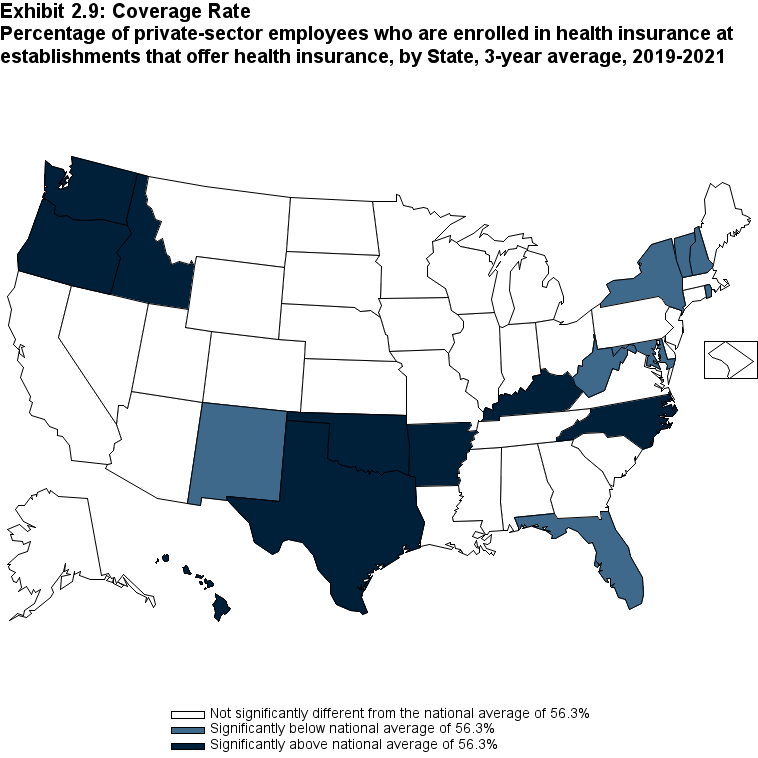
Exhibit 2.9: Coverage Rate Percentage (standard error) of private-sector employees who are enrolled in health insurance at establishments that offer health insurance, by State, 3-year average, 2019-2021
| Alabama | 58.6% | Kentucky | 60.5%* | North Dakota | 56.7% |
| (Standard Error) | (1.4%) | (Standard Error) | (1.2%) | (Standard Error) | (1.3%) |
| Alaska | 55.7% | Louisiana | 54.1% | Ohio | 56.2% |
| (Standard Error) | (1.5%) | (Standard Error) | (1.3%) | (Standard Error) | (1.3%) |
| Arizona | 53.9% | Maine | 56.7% | Oklahoma | 59.5%* |
| (Standard Error) | (1.8%) | (Standard Error) | (1.3%) | (Standard Error) | (1.4%) |
| Arkansas | 59.3%* | Maryland | 51.1%* | Oregon | 63.1%* |
| (Standard Error) | (1.2%) | (Standard Error) | (1.3%) | (Standard Error) | (1.3%) |
| California | 57.5% | Massachusetts | 54.5% | Pennsylvania | 57.0% |
| (Standard Error) | (1.1%) | (Standard Error) | (1.3%) | (Standard Error) | (1.0%) |
| Colorado | 57.5% | Michigan | 57.1% | Rhode Island | 53.0%* |
| (Standard Error) | (1.4%) | (Standard Error) | (1.3%) | (Standard Error) | (1.2%) |
| Connecticut | 55.1% | Minnesota | 58.6% | South Carolina | 56.6% |
| (Standard Error) | (1.3%) | (Standard Error) | (1.3%) | (Standard Error) | (1.3%) |
| Delaware | 55.0% | Mississippi | 58.6% | South Dakota | 56.4% |
| (Standard Error) | (1.8%) | (Standard Error) | (1.4%) | (Standard Error) | (1.1%) |
| District of Columbia | 58.5% | Missouri | 57.9% | Tennessee | 56.0% |
| (Standard Error) | (1.3%) | (Standard Error) | (1.4%) | (Standard Error) | (1.4%) |
| Florida | 52.8%* | Montana | 57.5% | Texas | 58.6%* |
| (Standard Error) | (1.5%) | (Standard Error) | (1.2%) | (Standard Error) | (1.0%) |
| Georgia | 54.6% | Nebraska | 57.3% | Utah | 54.8% |
| (Standard Error) | (1.7%) | (Standard Error) | (1.3%) | (Standard Error) | (1.6%) |
| Hawaii | 63.2%* | Nevada | 54.5% | Vermont | 53.4%* |
| (Standard Error) | (1.2%) | (Standard Error) | (1.2%) | (Standard Error) | (1.2%) |
| Idaho | 59.8%* | New Hampshire | 52.4%* | Virginia | 55.0% |
| (Standard Error) | (1.4%) | (Standard Error) | (1.2%) | (Standard Error) | (1.4%) |
| Illinois | 55.2% | New Jersey | 55.3% | Washington | 64.5%* |
| (Standard Error) | (1.1%) | (Standard Error) | (1.4%) | (Standard Error) | (1.7%) |
| Indiana | 56.9% | New Mexico | 52.7%* | West Virginia | 51.7%* |
| (Standard Error) | (1.2%) | (Standard Error) | (1.4%) | (Standard Error) | (1.4%) |
| Iowa | 56.1% | New York | 50.4%* | Wisconsin | 54.3% |
| (Standard Error) | (1.2%) | (Standard Error) | (0.8%) | (Standard Error) | (1.2%) |
| Kansas | 57.0% | North Carolina | 60.4%* | Wyoming | 57.4% |
| (Standard Error) | (1.3%) | (Standard Error) | (1.2%) | (Standard Error) | (2.1%) |
| Source: Medical Expenditure Panel Survey-Insurance Component,
private-sector establishments, 2019-2021. Denominator: Within each state, all employees in establishments that offer health insurance. Note: * Statistically different from national average of 56.3 percent at p < 0.05. Note that the standard error on the national estimate of 56.3 percent is 0.25. |
|||||
|---|---|---|---|---|---|
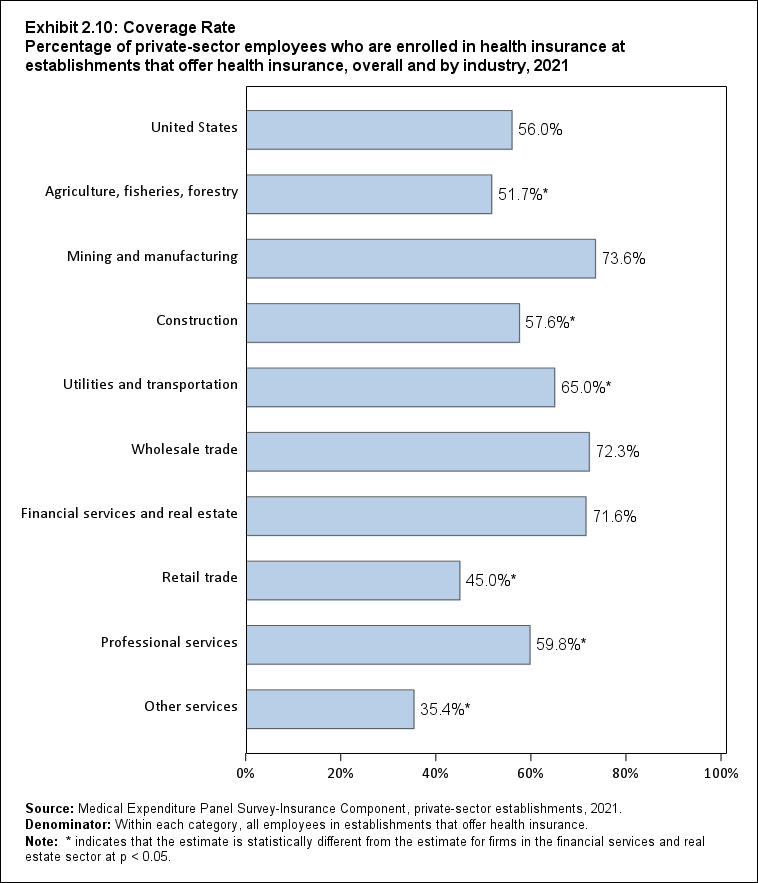
Exhibit 2.10: Coverage Rate Percentage (standard error) of private-sector employees who are enrolled in health insurance at establishments that offer health insurance, overall and by industry, 2021
| Industry | Percentage |
|---|---|
| United States | 56.0% |
| (Standard Error) | (0.4%) |
| Agriculture, fisheries, forestry | 51.7%* |
| (Standard Error) | (5.6%) |
| Mining and manufacturing | 73.6% |
| (Standard Error) | (0.7%) |
| Construction | 57.6%* |
| (Standard Error) | (2.2%) |
| Utilities and transportation | 65.0%* |
| (Standard Error) | (1.6%) |
| Wholesale trade | 72.3% |
| (Standard Error) | (1.7%) |
| Financial services and real estate | 71.6% |
| (Standard Error) | (1.0%) |
| Retail trade | 45.0%* |
| (Standard Error) | (1.0%) |
| Professional services | 59.8%* |
| (Standard Error) | (0.6%) |
| Other services | 35.4%* |
| (Standard Error) | (0.9%) |
| Source: Medical Expenditure Panel Survey-Insurance Component,
private-sector establishments, 2021. Denominator: Within each category, all employees in establishments that offer health insurance. Note: * indicates that the estimate is statistically different from the estimate for firms in the financial services and real estate sector at p < 0.05. |
|
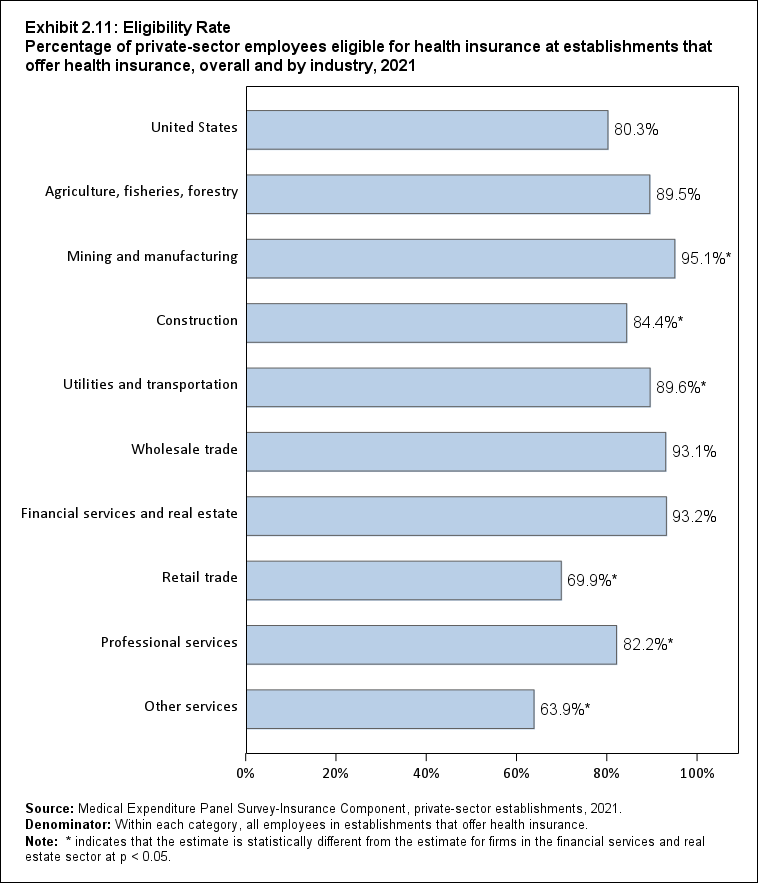
Exhibit 2.11: Eligibility Rate Percentage (standard error) of private-sector employees eligible for health insurance at establishments that offer health insurance, overall and by industry, 2021
| Industry | Percentage |
|---|---|
| United States | 80.3% |
| (Standard Error) | (0.4%) |
| Agriculture, fisheries, forestry | 89.5% |
| (Standard Error) | (2.9%) |
| Mining and manufacturing | 95.1%* |
| (Standard Error) | (0.3%) |
| Construction | 84.4%* |
| (Standard Error) | (2.2%) |
| Utilities and transportation | 89.6%* |
| (Standard Error) | (1.2%) |
| Wholesale trade | 93.1% |
| (Standard Error) | (0.7%) |
| Financial services and real estate | 93.2% |
| (Standard Error) | (0.6%) |
| Retail trade | 69.9%* |
| (Standard Error) | (1.0%) |
| Professional services | 82.2%* |
| (Standard Error) | (0.5%) |
| Other services | 63.9%* |
| (Standard Error) | (1.0%) |
| Source: Medical Expenditure Panel Survey-Insurance Component,
private-sector establishments, 2021. Denominator: Within each category, all employees in establishments that offer health insurance. Note: * indicates that the estimate is statistically different from the estimate for firms in the financial services and real estate sector at p < 0.05. |
|
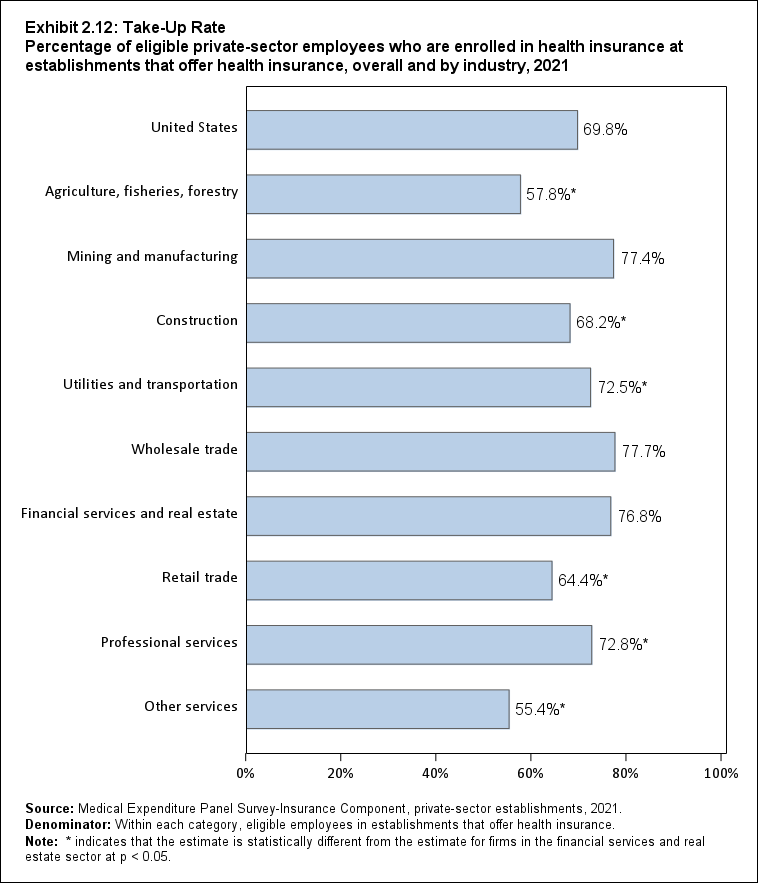
Exhibit 2.12: Take-Up Rate Percentage (standard error) of eligible private-sector employees who are enrolled in health insurance at establishments that offer health insurance, overall and by industry, 2021
| Industry | Percentage |
|---|---|
| United States | 69.8% |
| (Standard Error) | (0.4%) |
| Agriculture, fisheries, forestry | 57.8%* |
| (Standard Error) | (5.4%) |
| Mining and manufacturing | 77.4% |
| (Standard Error) | (0.7%) |
| Construction | 68.2%* |
| (Standard Error) | (1.7%) |
| Utilities and transportation | 72.5%* |
| (Standard Error) | (1.4%) |
| Wholesale trade | 77.7% |
| (Standard Error) | (1.5%) |
| Financial services and real estate | 76.8% |
| (Standard Error) | (0.9%) |
| Retail trade | 64.4%* |
| (Standard Error) | (1.0%) |
| Professional services | 72.8%* |
| (Standard Error) | (0.5%) |
| Other services | 55.4%* |
| (Standard Error) | (1.3%) |
| Source: Medical Expenditure Panel Survey-Insurance Component,
private-sector establishments, 2021. Denominator: Within each category, eligible employees in establishments that offer health insurance. Note: * indicates that the estimate is statistically different from the estimate for firms in the financial services and real estate sector at p < 0.05. |
|
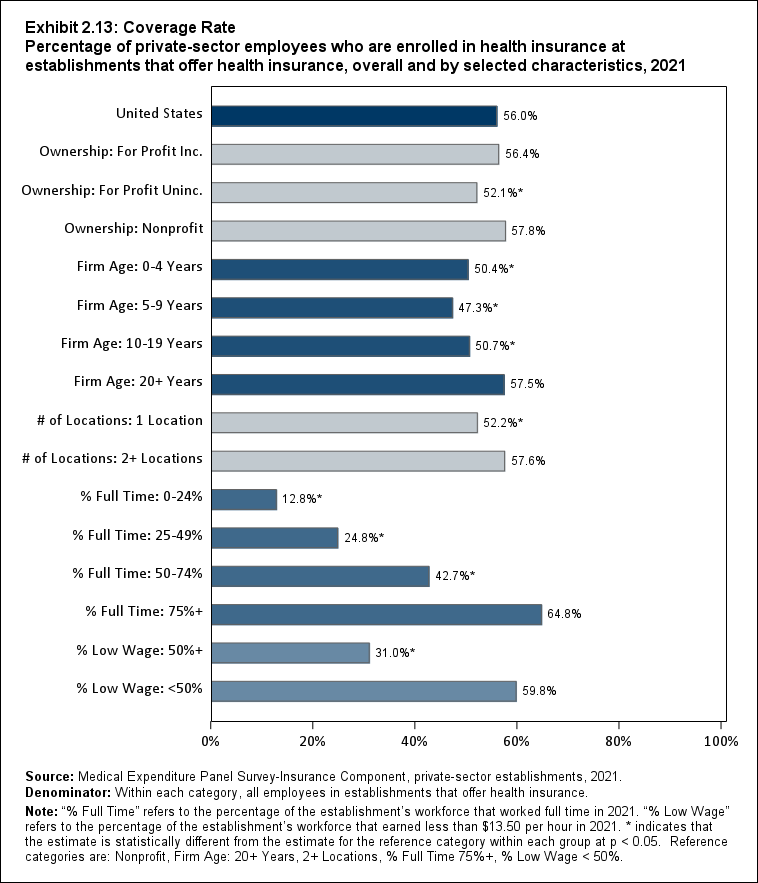
Exhibit 2.13: Coverage Rate Percentage (standard error) of private-sector employees who are enrolled in health insurance at establishments that offer health insurance, overall and by selected characteristics, 2021
| Employer Characteristics | Percentage |
|---|---|
| United States | 56.0% |
| (Standard Error) | (0.4%) |
| Ownership: For Profit Inc. | 56.4% |
| (Standard Error) | (0.5%) |
| Ownership: For Profit Uninc. | 52.1%* |
| (Standard Error) | (1.1%) |
| Ownership: Nonprofit | 57.8% |
| (Standard Error) | (0.8%) |
| Firm Age: 0-4 Years | 50.4%* |
| (Standard Error) | (2.5%) |
| Firm Age: 5-9 Years | 47.3%* |
| (Standard Error) | (2.0%) |
| Firm Age: 10-19 Years | 50.7%* |
| (Standard Error) | (1.4%) |
| Firm Age: 20+ Years | 57.5% |
| (Standard Error) | (0.4%) |
| # of Locations: 1 Location | 52.2%* |
| (Standard Error) | (0.7%) |
| # of Locations: 2+ Locations | 57.6% |
| (Standard Error) | (0.5%) |
| % Full Time: 0-24% | 12.8%* |
| (Standard Error) | (0.7%) |
| % Full Time: 25-49% | 24.8%* |
| (Standard Error) | (1.1%) |
| % Full Time: 50-74% | 42.7%* |
| (Standard Error) | (0.9%) |
| % Full Time: 75%+ | 64.8% |
| (Standard Error) | (0.5%) |
| % Low Wage: 50%+ | 31.0%* |
| (Standard Error) | (0.9%) |
| % Low Wage: <50% | 59.8% |
| (Standard Error) | (0.4%) |
| Source: Medical Expenditure Panel Survey-Insurance Component,
private-sector establishments, 2021. Denominator: Within each category, all employees in establishments that offer health insurance. Note: "% Full Time" refers to the percentage of the establishment's workforce that worked full time in 2021. "% Low Wage" refers to the percentage of the establishment's workforce that earned less than $13.50 per hour in 2021. * indicates that the estimate is statistically different from the estimate for the reference category within each group at p < 0.05. Reference categories are: Nonprofit, Firm Age: 20+ Years, 2+ Locations, % Full Time 75%+, % Low Wage < 50%. |
|
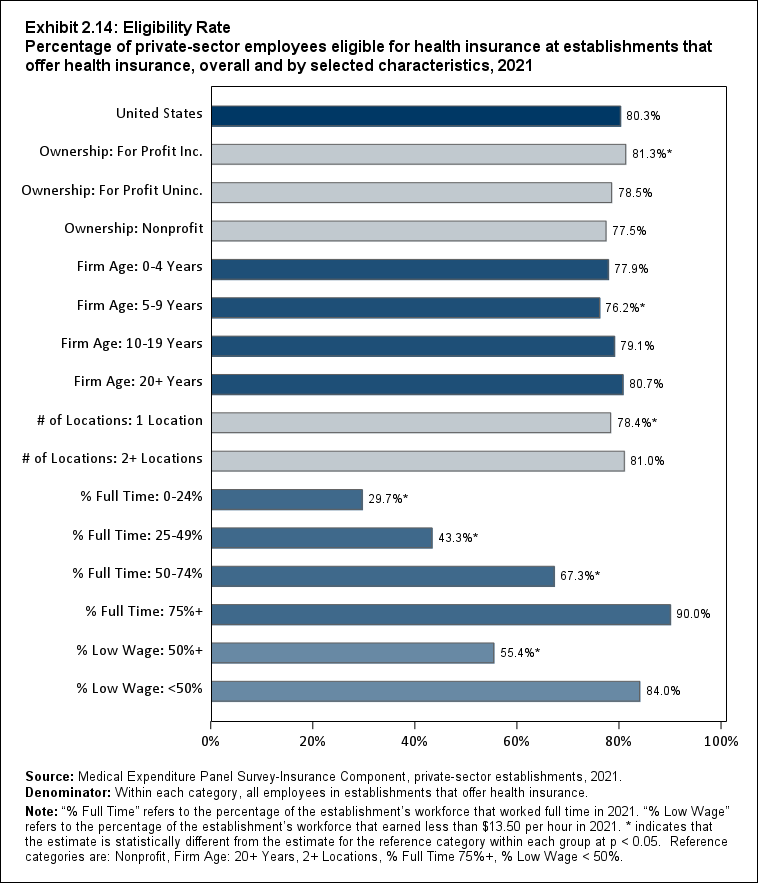
Exhibit 2.14: Eligibility Rate Percentage (standard error) of private-sector employees eligible for health insurance at establishments that offer health insurance, overall and by selected characteristics, 2021
| Employer Characteristics | Percentage |
|---|---|
| United States | 80.3% |
| (Standard Error) | (0.4%) |
| Ownership: For Profit Inc. | 81.3%* |
| (Standard Error) | (0.4%) |
| Ownership: For Profit Uninc. | 78.5% |
| (Standard Error) | (0.9%) |
| Ownership: Nonprofit | 77.5% |
| (Standard Error) | (0.8%) |
| Firm Age: 0-4 Years | 77.9% |
| (Standard Error) | (2.1%) |
| Firm Age: 5-9 Years | 76.2%* |
| (Standard Error) | (1.9%) |
| Firm Age: 10-19 Years | 79.1% |
| (Standard Error) | (1.1%) |
| Firm Age: 20+ Years | 80.7% |
| (Standard Error) | (0.4%) |
| # of Locations: 1 Location | 78.4%* |
| (Standard Error) | (0.7%) |
| # of Locations: 2+ Locations | 81.0% |
| (Standard Error) | (0.4%) |
| % Full Time: 0-24% | 29.7%* |
| (Standard Error) | (1.6%) |
| % Full Time: 25-49% | 43.3%* |
| (Standard Error) | (1.3%) |
| % Full Time: 50-74% | 67.3%* |
| (Standard Error) | (0.8%) |
| % Full Time: 75%+ | 90.0% |
| (Standard Error) | (0.3%) |
| % Low Wage: 50%+ | 55.4%* |
| (Standard Error) | (1.1%) |
| % Low Wage: <50% | 84.0% |
| (Standard Error) | (0.4%) |
| Source: Medical Expenditure Panel Survey-Insurance Component,
private-sector establishments, 2021. Denominator: Within each category, all employees in establishments that offer health insurance. Note: "% Full Time" refers to the percentage of the establishment's workforce that worked full time in 2021. "% Low Wage" refers to the percentage of the establishment's workforce that earned less than $13.50 per hour in 2021. * indicates that the estimate is statistically different from the estimate for the reference category within each group at p < 0.05. Reference categories are: Nonprofit, Firm Age: 20+ Years, 2+ Locations, % Full Time 75%+, % Low Wage < 50%. |
|
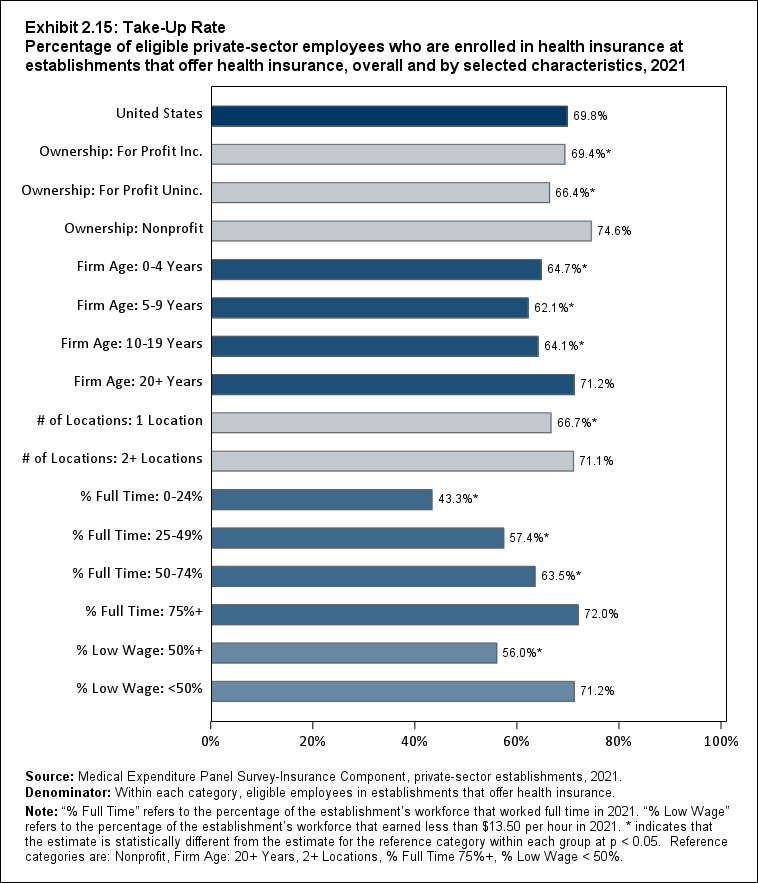
Exhibit 2.15: Take-Up Rate Percentage (standard error) of eligible private-sector employees who are enrolled in health insurance at establishments that offer health insurance, overall and by selected characteristics, 2021
| Employer Characteristics | Percentage |
|---|---|
| United States | 69.8% |
| (Standard Error) | (0.4%) |
| Ownership: For Profit Inc. | 69.4%* |
| (Standard Error) | (0.5%) |
| Ownership: For Profit Uninc. | 66.4%* |
| (Standard Error) | (1.2%) |
| Ownership: Nonprofit | 74.6% |
| (Standard Error) | (0.6%) |
| Firm Age: 0-4 Years | 64.7%* |
| (Standard Error) | (2.4%) |
| Firm Age: 5-9 Years | 62.1%* |
| (Standard Error) | (2.0%) |
| Firm Age: 10-19 Years | 64.1%* |
| (Standard Error) | (1.5%) |
| Firm Age: 20+ Years | 71.2% |
| (Standard Error) | (0.4%) |
| # of Locations: 1 Location | 66.7%* |
| (Standard Error) | (0.7%) |
| # of Locations: 2+ Locations | 71.1% |
| (Standard Error) | (0.5%) |
| % Full Time: 0-24% | 43.3%* |
| (Standard Error) | (2.6%) |
| % Full Time: 25-49% | 57.4%* |
| (Standard Error) | (1.5%) |
| % Full Time: 50-74% | 63.5%* |
| (Standard Error) | (1.0%) |
| % Full Time: 75%+ | 72.0% |
| (Standard Error) | (0.4%) |
| % Low Wage: 50%+ | 56.0%* |
| (Standard Error) | (1.2%) |
| % Low Wage: <50% | 71.2% |
| (Standard Error) | (0.4%) |
| Source: Medical Expenditure Panel Survey-Insurance Component,
private-sector establishments, 2021. Denominator: Within each category, eligible employees in establishments that offer health insurance. Note: "% Full Time" refers to the percentage of the establishment's workforce that worked full time in 2021. "% Low Wage" refers to the percentage of the establishment's workforce that earned less than $13.50 per hour in 2021. * indicates that the estimate is statistically different from the estimate for the reference category within each group at p < 0.05. Reference categories are: Nonprofit, Firm Age: 20+ Years, 2+ Locations, % Full Time 75%+, % Low Wage < 50%. |
|
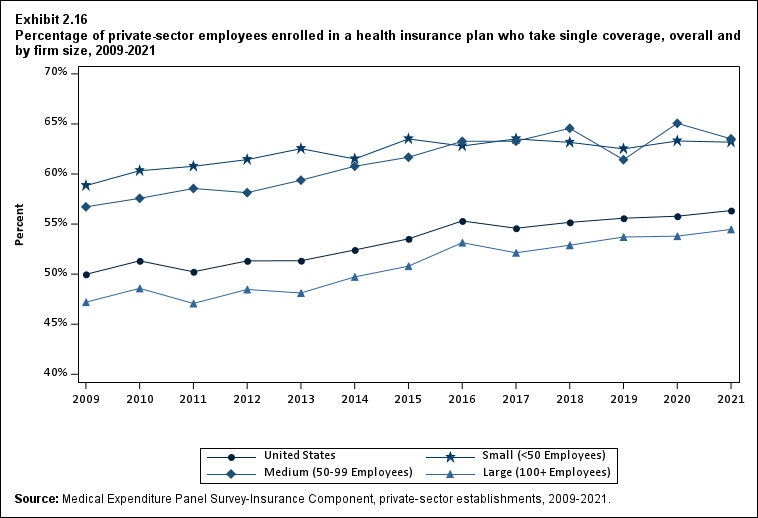
Exhibit 2.16 Percentage (standard error) of private-sector employees enrolled in a health insurance plan who take single coverage, overall and by firm size, 2009-2021
| Number of Employees | 2009 | 2010 | 2011 | 2012 | 2013 | 2014 | 2015 | 2016 | 2017 | 2018 | 2019 | 2020 | 2021 |
|---|---|---|---|---|---|---|---|---|---|---|---|---|---|
| U.S. | 50.0% | 51.3%* | 50.2%* | 51.3%* | 51.3% | 52.4%* | 53.5%* | 55.3%* | 54.6% | 55.2% | 55.6% | 55.8% | 56.3% |
| (Standard Error) | (0.2%) | (0.3%) | (0.3%) | (0.3%) | (0.2%) | (0.3%) | (0.3%) | (0.3%) | (0.3%) | (0.3%) | (0.3%) | (0.3%) | (0.3%) |
| <50 | 58.8% | 60.3%* | 60.8% | 61.4% | 62.5% | 61.5% | 63.5%* | 62.8% | 63.5% | 63.2% | 62.5% | 63.3% | 63.2%^ |
| (Standard Error) | (0.5%) | (0.6%) | (0.7%) | (0.5%) | (0.7%) | (0.6%) | (0.6%) | (0.6%) | (0.6%) | (0.6%) | (0.7%) | (0.7%) | (0.8%) |
| 50-99 | 56.7% | 57.6% | 58.6% | 58.1% | 59.4% | 60.8% | 61.7% | 63.3% | 63.3% | 64.6% | 61.4%* | 65.1%* | 63.5%^ |
| (Standard Error) | (1.1%) | (1.2%) | (0.9%) | (0.6%) | (0.8%) | (1.0%) | (1.0%) | (1.0%) | (1.0%) | (0.9%) | (1.2%) | (1.2%) | (1.1%) |
| 100+ | 47.2% | 48.6%* | 47.1%* | 48.5%* | 48.1% | 49.7%* | 50.8%* | 53.1%* | 52.1%* | 52.9% | 53.7% | 53.8% | 54.5% |
| (Standard Error) | (0.2%) | (0.3%) | (0.4%) | (0.3%) | (0.2%) | (0.4%) | (0.3%) | (0.3%) | (0.3%) | (0.3%) | (0.4%) | (0.3%) | (0.3%) |
| Source: Medical Expenditure Panel Survey-Insurance Component,
private-sector establishments, 2009-2021. Note: * indicates the estimate is statistically different from the previous year at p < 0.05. ^ indicates that the estimates for firms with <50 and 50-99 employees are statistically different from the estimate for firms with 100+ employees at p < 0.05. This test is conducted for 2021 only. |
|||||||||||||
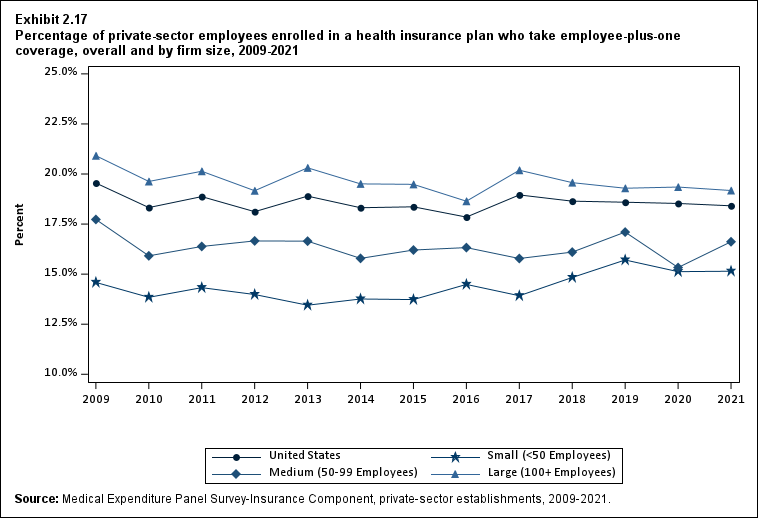
Exhibit 2.17 Percentage (standard error) of private-sector employees enrolled in a health insurance plan who take employee-plus-one coverage, overall and by firm size, 2009-2021
| Number of Employees | 2009 | 2010 | 2011 | 2012 | 2013 | 2014 | 2015 | 2016 | 2017 | 2018 | 2019 | 2020 | 2021 |
|---|---|---|---|---|---|---|---|---|---|---|---|---|---|
| U.S. | 19.5% | 18.3%* | 18.9% | 18.1%* | 18.9%* | 18.3%* | 18.4% | 17.8%* | 19.0%* | 18.6% | 18.6% | 18.5% | 18.4% |
| (Standard Error) | (0.2%) | (0.2%) | (0.2%) | (0.2%) | (0.1%) | (0.2%) | (0.2%) | (0.2%) | (0.2%) | (0.2%) | (0.2%) | (0.2%) | (0.2%) |
| <50 | 14.6% | 13.8% | 14.3% | 14.0% | 13.4% | 13.8% | 13.7% | 14.5% | 13.9% | 14.8% | 15.7% | 15.1% | 15.1%^ |
| (Standard Error) | (0.4%) | (0.3%) | (0.2%) | (0.4%) | (0.2%) | (0.3%) | (0.4%) | (0.4%) | (0.4%) | (0.4%) | (0.5%) | (0.4%) | (0.5%) |
| 50-99 | 17.7% | 15.9% | 16.4% | 16.7% | 16.6% | 15.8% | 16.2% | 16.3% | 15.8% | 16.1% | 17.1% | 15.3%* | 16.6%^ |
| (Standard Error) | (0.8%) | (0.6%) | (0.5%) | (0.5%) | (0.6%) | (0.6%) | (0.6%) | (0.6%) | (0.6%) | (0.5%) | (0.6%) | (0.6%) | (0.6%) |
| 100+ | 20.9% | 19.6%* | 20.1% | 19.2%* | 20.3%* | 19.5%* | 19.5% | 18.6%* | 20.2%* | 19.6%* | 19.3% | 19.3% | 19.2% |
| (Standard Error) | (0.2%) | (0.3%) | (0.3%) | (0.2%) | (0.1%) | (0.2%) | (0.2%) | (0.2%) | (0.2%) | (0.2%) | (0.2%) | (0.2%) | (0.2%) |
| Source: Medical Expenditure Panel Survey-Insurance Component,
private-sector establishments, 2009-2021. Note: * indicates the estimate is statistically different from the previous year at p < 0.05. ^ indicates that the estimates for firms with <50 and 50-99 employees are statistically different from the estimate for firms with 100+ employees at p < 0.05. This test is conducted for 2021 only. |
|||||||||||||
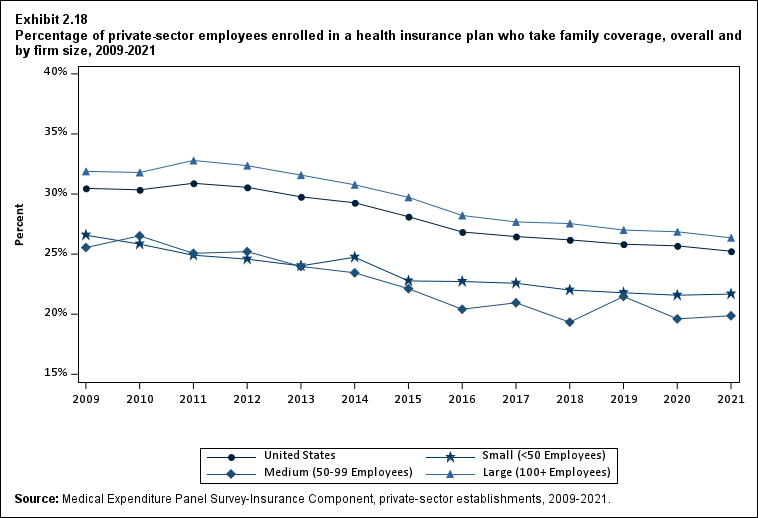
Exhibit 2.18 Percentage (standard error) of private-sector employees enrolled in a health insurance plan who take family coverage, overall and by firm size, 2009-2021
| Number of Employees | 2009 | 2010 | 2011 | 2012 | 2013 | 2014 | 2015 | 2016 | 2017 | 2018 | 2019 | 2020 | 2021 |
|---|---|---|---|---|---|---|---|---|---|---|---|---|---|
| U.S. | 30.5% | 30.3% | 30.9% | 30.6% | 29.8%* | 29.3% | 28.1%* | 26.8%* | 26.5% | 26.2% | 25.8% | 25.7% | 25.2% |
| (Standard Error) | (0.3%) | (0.3%) | (0.3%) | (0.3%) | (0.2%) | (0.3%) | (0.2%) | (0.3%) | (0.3%) | (0.2%) | (0.3%) | (0.3%) | (0.3%) |
| <50 | 26.6% | 25.8% | 24.9% | 24.6% | 24.0% | 24.7% | 22.8%* | 22.7% | 22.6% | 22.0% | 21.8% | 21.6% | 21.7%^ |
| (Standard Error) | (0.5%) | (0.4%) | (0.6%) | (0.4%) | (0.6%) | (0.5%) | (0.5%) | (0.5%) | (0.6%) | (0.5%) | (0.6%) | (0.6%) | (0.7%) |
| 50-99 | 25.5% | 26.5% | 25.1% | 25.2% | 24.0% | 23.4% | 22.1% | 20.4% | 20.9% | 19.3% | 21.5% | 19.6% | 19.9%^ |
| (Standard Error) | (0.7%) | (0.9%) | (1.0%) | (0.7%) | (0.5%) | (0.8%) | (0.9%) | (0.9%) | (0.9%) | (0.8%) | (0.9%) | (1.1%) | (0.9%) |
| 100+ | 31.9% | 31.8% | 32.8%* | 32.4% | 31.6%* | 30.8%* | 29.7%* | 28.2%* | 27.7% | 27.5% | 27.0% | 26.9% | 26.4% |
| (Standard Error) | (0.3%) | (0.4%) | (0.3%) | (0.3%) | (0.2%) | (0.3%) | (0.3%) | (0.3%) | (0.3%) | (0.3%) | (0.3%) | (0.3%) | (0.3%) |
| Source: Medical Expenditure Panel Survey-Insurance Component,
private-sector establishments, 2009-2021. Note: * indicates the estimate is statistically different from the previous year at p < 0.05. ^ indicates that the estimates for firms with <50 and 50-99 employees are statistically different from the estimate for firms with 100+ employees at p < 0.05. This test is conducted for 2021 only. |
|||||||||||||
Section 3: Health Insurance Premiums
This section presents estimates of total health insurance premiums (i.e., the amount of premiums paid by employees plus the amount paid by employers on behalf of their employees) for single, employee-plus-one, and family coverage. The section includes recent premium growth rates and trends in growth rates from 2009 to 2021 overall and by firm size.
This section also presents information on variation in total premiums in 2021 by firm size, State where the employer is located, industry, and other employer characteristics (including ownership type, firm age, and single- versus multilocation status). It also presents variation in total premiums by workforce characteristics in each establishment (including percentage of full-time workers and percentage of low-wage workers). Finally, this section provides information on the distribution of premiums, overall and by firm size.
In the MEPS-IC, respondents are asked to report total premiums for fully insured plans and to report total premium equivalents for self-insured plans. If employee-plus-one premiums were different for employee-plus-child and employee-plus-spouse coverage, respondents were instructed to report for employee-plus-one child. If premiums for family coverage varied by family size, respondents were instructed to report for a family of four. If an employer's premiums varied across employees for other reasons, respondents were instructed to report for the "typical" employee.
In employer-sponsored health insurance plans, total premiums may vary for many reasons, including demographic and health characteristics of employers' workforces and employers' industry and firm size. In addition, premiums may vary due to differences in plan provider networks, covered services, and actuarial values (i.e., the percentage of covered medical expenses paid by the plan, rather than out of pocket by a typical group of enrollees). State-level factors that may affect premiums include healthcare prices and utilization, as well as differences in State approaches to regulating private insurance.
Highlights
- In 2021, average total health insurance premiums were $7,380 for single coverage, $14,634 for employee-plus-one coverage, and $21,381 for family coverage. These amounts represented an increase over 2020 that ranged from 3.0 to 3.2 percent for the three types of coverage (Exhibits 3.1 and 3.2). These 1-year percentage increases were not significantly different from the average annual growth rates from 2009 to 2021, which ranged from 3.9 to 4.2 percent across the three types of coverage.
- In 2021, overall total premium distributions for all three types of coverage showed substantial variation. The value of the premium at the 90th percentile was more than twice the value of the premium at the 10th percentile for single ($10,000 vs. $4,700), employee-plus-one ($21,000 vs. $9,100), and family coverage ($29,000 vs. $14,000) (Exhibit 3.15).
- Average annual total premiums for 2019-2021 showed strong regional variation that was fairly consistent
for single, employee-plus-one, and family coverage (Exhibits 3.6, 3.7, and 3.8):
- In the Northeast census region, six of nine States had average annual total premiums that were higher than the national average for all three types of coverage. In the other three census regions, only two States (Alaska and the District of Columbia) had higher than average premiums for all three types of coverage.
- Thirteen States had average annual total premiums that were lower than the national average for all three types of coverage. Six of these States are located in the Southern census region, five are in the West, and two are in the Midwest.
Key Trends and Differences
Variation in total premiums in 2021 followed a number of patterns that are in line with longer term trends. Average total premiums for single, employee-plus-one, and family coverage were consistently higher at nonprofit establishments and in the oldest firms (in business for 20 or more years). For single and employee-plus one coverage, premiums were higher in establishments with less than 50 percent low-wage workers. Premiums for both types of dependent coverage (employee plus one and family) were higher in multilocation firms.
Premiums in small firms (fewer than 50 employees) for single, employee-plus-one, and family coverage were lower than premiums at large firms (100+ employees) at the lower end of the premium distribution (10th percentile and 25th percentiles). However, they were almost always higher at the upper end of the distribution (75th and 90th percentile). The one exception was that there was no difference in the 75th percentile family premium between small and large firms.

Exhibit 3.1 Average total premiums (standard error) per enrolled employee for single, employee-plus-one and family coverage, 2009-2021
| Coverage | 2009 | 2010 | 2011 | 2012 | 2013 | 2014 | 2015 | 2016 | 2017 | 2018 | 2019 | 2020 | 2021 |
|---|---|---|---|---|---|---|---|---|---|---|---|---|---|
| Single | $4,669 | $4,940* | $5,222* | $5,384* | $5,571* | $5,832* | $5,963* | $6,101* | $6,368* | $6,715* | $6,972* | $7,149* | $7,380* |
| (Standard Error) | ($21) | ($22) | ($26) | ($28) | ($23) | ($25) | ($26) | ($27) | ($28) | ($31) | ($35) | ($35) | ($37) |
| Plus One | $9,053 | $9,664* | $10,329* | $10,621* | $10,990* | $11,503* | $11,800* | $12,124* | $12,789* | $13,425* | $13,989* | $14,191 | $14,634* |
| (Standard Error) | ($34) | ($60) | ($105) | ($56) | ($54) | ($60) | ($58) | ($60) | ($70) | ($70) | ($83) | ($93) | ($84) |
| Family | $13,027 | $13,871* | $15,022* | $15,473* | $16,029* | $16,655* | $17,322* | $17,710* | $18,687* | $19,565* | $20,486* | $20,758 | $21,381* |
| (Standard Error) | ($25) | ($75) | ($98) | ($95) | ($61) | ($79) | ($95) | ($84) | ($105) | ($104) | ($125) | ($124) | ($111) |
| Source: Medical Expenditure Panel Survey-Insurance Component,
private-sector establishments, 2009-2021. Note: * indicates the estimate is statistically different from the previous year at p < 0.05. |
|||||||||||||

Exhibit 3.2 Percentage change (standard error) in total premiums from previous year per enrolled employee for single, employee-plus-one, and family coverage, 2009-2021
| Year | Single | Plus one | Family |
|---|---|---|---|
| 2009 | 6.5%* | 6.1%* | 5.9%* |
| (Standard Error) | ($0.6%) | ($0.7%) | ($0.7%) |
| 2010 | 5.8%* | 6.7%* | 6.5%* |
| (Standard Error) | ($0.7%) | ($0.8%) | ($0.6%) |
| 2011 | 5.7%* | 6.9%* | 8.3%* |
| (Standard Error) | ($0.7%) | ($1.3%) | ($0.9%) |
| 2012 | 3.1%* | 2.8%* | 3.0%* |
| (Standard Error) | ($0.7%) | ($1.2%) | ($0.9%) |
| 2013 | 3.5%* | 3.5%* | 3.6%* |
| (Standard Error) | ($0.7%) | ($0.7%) | ($0.7%) |
| 2014 | 4.7%* | 4.7%* | 3.9%* |
| (Standard Error) | ($0.6%) | ($0.7%) | ($0.6%) |
| 2015 | 2.2%* | 2.6%* | 4.0%* |
| (Standard Error) | ($0.6%) | ($0.7%) | ($0.8%) |
| 2016 | 2.3%* | 2.7%* | 2.2%* |
| (Standard Error) | ($0.6%) | ($0.7%) | ($0.7%) |
| 2017 | 4.4%* | 5.5%* | 5.5%* |
| (Standard Error) | ($0.7%) | ($0.8%) | ($0.8%) |
| 2018 | 5.4%* | 5.0%* | 4.7%* |
| (Standard Error) | ($0.7%) | ($0.8%) | ($0.8%) |
| 2019 | 3.8%* | 4.2%* | 4.7%* |
| (Standard Error) | ($0.7%) | ($0.8%) | ($0.8%) |
| 2020 | 2.5%* | 1.4% | 1.3% |
| (Standard Error) | ($0.7%) | ($0.9%) | ($0.9%) |
| 2021 | 3.2%* | 3.1%* | 3.0%* |
| (Standard Error) | ($0.7%) | ($0.9%) | ($0.8%) |
| Source: Medical Expenditure Panel Survey-Insurance Component,
private-sector establishments, 2009-2021. Note: * indicates the estimate is statistically different from zero at p < 0.05. |
|||
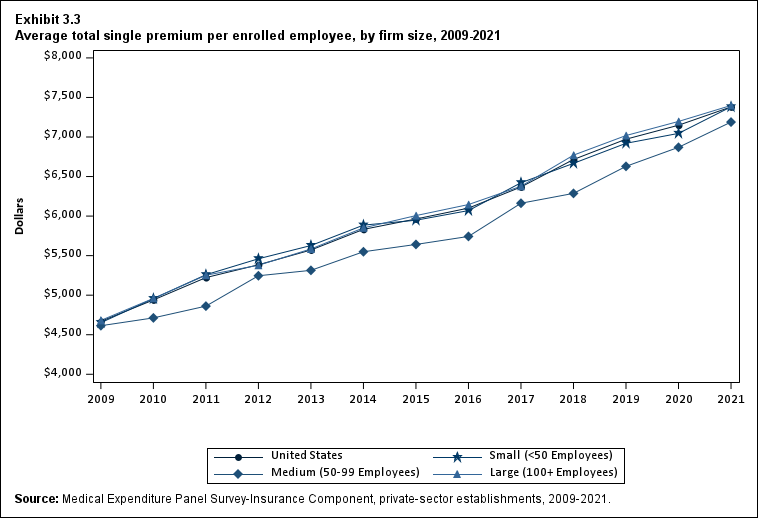
Exhibit 3.3 Average total single premium (standard error) per enrolled employee, by firm size, 2009-2021
| Number of Employees | 2009 | 2010 | 2011 | 2012 | 2013 | 2014 | 2015 | 2016 | 2017 | 2018 | 2019 | 2020 | 2021 |
|---|---|---|---|---|---|---|---|---|---|---|---|---|---|
| U.S. | $4,669 | $4,940* | $5,222* | $5,384* | $5,571* | $5,832* | $5,963* | $6,101* | $6,368* | $6,715* | $6,972* | $7,149* | $7,380* |
| (Standard Error) | ($21) | ($22) | ($26) | ($28) | ($23) | ($25) | ($26) | ($27) | ($28) | ($31) | ($35) | ($35) | ($37) |
| <50 | $4,652 | $4,956* | $5,258* | $5,460* | $5,628* | $5,886* | $5,947 | $6,070 | $6,421* | $6,667* | $6,920* | $7,045 | $7,382* |
| (Standard Error) | ($31) | ($34) | ($39) | ($60) | ($39) | ($55) | ($55) | ($53) | ($61) | ($63) | ($73) | ($70) | ($84) |
| 50-99 | $4,614 | $4,713 | $4,861 | $5,246* | $5,314 | $5,549* | $5,642 | $5,743 | $6,163* | $6,287 | $6,629* | $6,870 | $7,189 |
| (Standard Error) | ($82) | ($52) | ($75) | ($39) | ($73) | ($82) | ($104) | ($96) | ($121) | ($111) | ($99) | ($129) | ($129) |
| 100+ | $4,681 | $4,959* | $5,252* | $5,378* | $5,584* | $5,851* | $6,006* | $6,146* | $6,377* | $6,770* | $7,019* | $7,197* | $7,399* |
| (Standard Error) | ($38) | ($23) | ($31) | ($28) | ($29) | ($30) | ($31) | ($32) | ($33) | ($37) | ($42) | ($41) | ($43) |
| Source: Medical Expenditure Panel Survey-Insurance Component,
private-sector establishments, 2009-2021. Note: * indicates the estimate is statistically different from the previous year at p < 0.05. ^ indicates that the estimates for firms with <50 and 50-99 employees are statistically different from the estimate for firms with 100+ employees at p < 0.05. This test is conducted for 2021 only. |
|||||||||||||
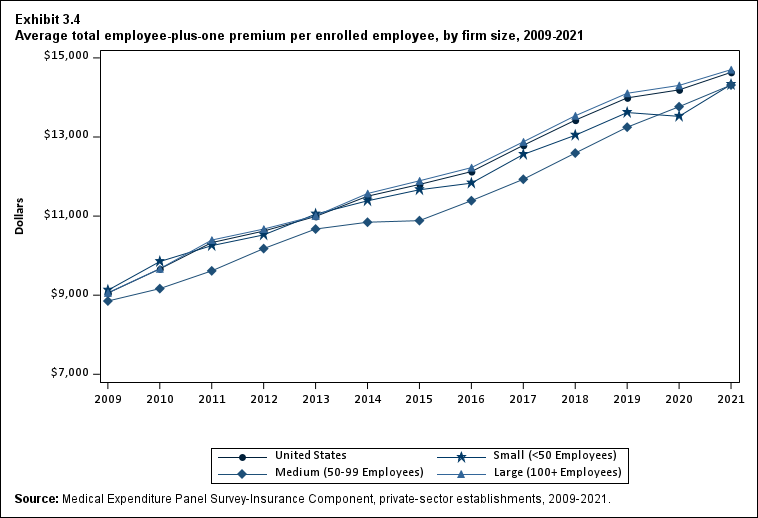
Exhibit 3.4 Average total employee-plus-one premium (standard error) per enrolled employee, by firm size, 2009-2021
| Number of Employees | 2009 | 2010 | 2011 | 2012 | 2013 | 2014 | 2015 | 2016 | 2017 | 2018 | 2019 | 2020 | 2021 |
|---|---|---|---|---|---|---|---|---|---|---|---|---|---|
| U.S. | $9,053 | $9,664* | $10,329* | $10,621* | $10,990* | $11,503* | $11,800* | $12,124* | $12,789* | $13,425* | $13,989* | $14,191 | $14,634* |
| (Standard Error) | ($34) | ($60) | ($105) | ($56) | ($54) | ($60) | ($58) | ($60) | ($70) | ($70) | ($83) | ($93) | ($84) |
| <50 | $9,124 | $9,850* | $10,253* | $10,524 | $11,050* | $11,386 | $11,666 | $11,833 | $12,558* | $13,044* | $13,619 | $13,522 | $14,326* |
| (Standard Error) | ($119) | ($80) | ($104) | ($121) | ($92) | ($163) | ($158) | ($156) | ($170) | ($176) | ($248) | ($212) | ($262) |
| 50-99 | $8,852 | $9,166 | $9,615* | $10,178* | $10,673 | $10,845 | $10,885 | $11,389 | $11,931 | $12,593* | $13,248 | $13,766 | $14,314 |
| (Standard Error) | ($148) | ($124) | ($192) | ($185) | ($330) | ($187) | ($198) | ($227) | ($232) | ($236) | ($321) | ($246) | ($295) |
| 100+ | $9,058 | $9,669* | $10,394* | $10,672* | $11,006* | $11,571* | $11,892* | $12,225* | $12,878* | $13,537* | $14,105* | $14,304 | $14,703* |
| (Standard Error) | ($34) | ($62) | ($113) | ($70) | ($59) | ($68) | ($66) | ($68) | ($79) | ($79) | ($92) | ($106) | ($93) |
| Source: Medical Expenditure Panel Survey-Insurance Component,
private-sector establishments, 2009-2021. Note: * indicates the estimate is statistically different from the previous year at p < 0.05. ^ indicates that the estimates for firms with <50 and 50-99 employees are statistically different from the estimate for firms with 100+ employees at p < 0.05. This test is conducted for 2021 only. |
|||||||||||||

Exhibit 3.5 Average total family premium (standard error) per enrolled employee, by firm size, 2009-2021
| Number of Employees | 2009 | 2010 | 2011 | 2012 | 2013 | 2014 | 2015 | 2016 | 2017 | 2018 | 2019 | 2020 | 2021 |
|---|---|---|---|---|---|---|---|---|---|---|---|---|---|
| U.S. | $13,027 | $13,871* | $15,022* | $15,473* | $16,029* | $16,655* | $17,322* | $17,710* | $18,687* | $19,565* | $20,486* | $20,758 | $21,381* |
| (Standard Error) | ($25) | ($75) | ($98) | ($95) | ($61) | ($79) | ($95) | ($84) | ($105) | ($104) | ($125) | ($124) | ($111) |
| <50 | $12,041 | $13,170* | $14,086* | $14,496 | $14,787 | $15,575* | $15,919 | $16,471 | $17,649* | $18,296* | $19,417* | $19,416 | $20,406*^ |
| (Standard Error) | ($129) | ($111) | ($145) | ($181) | ($89) | ($177) | ($212) | ($207) | ($192) | ($231) | ($303) | ($283) | ($320) |
| 50-99 | $12,431 | $13,019* | $14,151* | $15,421* | $15,376 | $15,732 | $16,336 | $16,214 | $17,735* | $18,386 | $19,893* | $19,827 | $20,551^ |
| (Standard Error) | ($229) | ($153) | ($168) | ($273) | ($268) | ($274) | ($335) | ($348) | ($327) | ($473) | ($435) | ($422) | ($396) |
| 100+ | $13,271 | $14,074* | $15,245* | $15,641* | $16,284* | $16,903* | $17,612* | $18,000* | $18,911* | $19,824* | $20,697* | $20,990 | $21,584* |
| (Standard Error) | ($33) | ($85) | ($117) | ($114) | ($82) | ($91) | ($110) | ($95) | ($122) | ($118) | ($143) | ($139) | ($124) |
| Source: Medical Expenditure Panel Survey-Insurance Component,
private-sector establishments, 2009-2021. Note: * indicates the estimate is statistically different from the previous year at p < 0.05. ^ indicates that the estimates for firms with <50 and 50-99 employees are statistically different from the estimate for firms with 100+ employees at p < 0.05. This test is conducted for 2021 only. |
|||||||||||||

Exhibit 3.6 Average total single premium (standard error) per enrolled employee, by State, 3-year average, 2019-2021
| Alabama | $6,481* | Kentucky | $6,918* | North Dakota | $6,998 |
| (Standard Error) | ($101) | (Standard Error) | ($88) | (Standard Error) | ($86) |
| Alaska | $8,798* | Louisiana | $6,696* | Ohio | $7,030 |
| (Standard Error) | ($232) | (Standard Error) | ($98) | (Standard Error) | ($100) |
| Arizona | $6,559* | Maine | $7,467* | Oklahoma | $6,893* |
| (Standard Error) | ($92) | (Standard Error) | ($93) | (Standard Error) | ($104) |
| Arkansas | $6,220* | Maryland | $7,182 | Oregon | $6,929 |
| (Standard Error) | ($104) | (Standard Error) | ($116) | (Standard Error) | ($154) |
| California | $7,165 | Massachusetts | $7,623* | Pennsylvania | $7,218 |
| (Standard Error) | ($87) | (Standard Error) | ($101) | (Standard Error) | ($87) |
| Colorado | $6,819* | Michigan | $6,804* | Rhode Island | $7,485* |
| (Standard Error) | ($105) | (Standard Error) | ($116) | (Standard Error) | ($104) |
| Connecticut | $7,512* | Minnesota | $7,020 | South Carolina | $7,091 |
| (Standard Error) | ($113) | (Standard Error) | ($109) | (Standard Error) | ($99) |
| Delaware | $7,701* | Mississippi | $6,533* | South Dakota | $7,133 |
| (Standard Error) | ($162) | (Standard Error) | ($105) | (Standard Error) | ($80) |
| District of Columbia | $7,684* | Missouri | $7,007 | Tennessee | $6,564* |
| (Standard Error) | ($120) | (Standard Error) | ($107) | (Standard Error) | ($90) |
| Florida | $7,002 | Montana | $6,957 | Texas | $6,992 |
| (Standard Error) | ($116) | (Standard Error) | ($98) | (Standard Error) | ($74) |
| Georgia | $6,948 | Nebraska | $7,263 | Utah | $6,454* |
| (Standard Error) | ($131) | (Standard Error) | ($100) | (Standard Error) | ($103) |
| Hawaii | $6,715* | Nevada | $6,550* | Vermont | $7,676* |
| (Standard Error) | ($91) | (Standard Error) | ($122) | (Standard Error) | ($90) |
| Idaho | $6,549* | New Hampshire | $7,662* | Virginia | $6,948 |
| (Standard Error) | ($103) | (Standard Error) | ($103) | (Standard Error) | ($88) |
| Illinois | $7,244 | New Jersey | $7,531* | Washington | $7,232 |
| (Standard Error) | ($82) | (Standard Error) | ($129) | (Standard Error) | ($119) |
| Indiana | $7,238 | New Mexico | $7,165 | West Virginia | $7,287 |
| (Standard Error) | ($102) | (Standard Error) | ($105) | (Standard Error) | ($125) |
| Iowa | $6,798* | New York | $8,126* | Wisconsin | $7,107 |
| (Standard Error) | ($95) | (Standard Error) | ($93) | (Standard Error) | ($100) |
| Kansas | $6,563* | North Carolina | $6,922* | Wyoming | $7,550* |
| (Standard Error) | ($100) | (Standard Error) | ($85) | (Standard Error) | ($159) |
| Source: Medical Expenditure Panel Survey-Insurance Component,
private-sector establishments, 2019-2021. Note: * Statistically different from national average of $7,103 at p < 0.05. Note that the standard error on the national estimate of $7,103 is $20.08. |
|||||
|---|---|---|---|---|---|
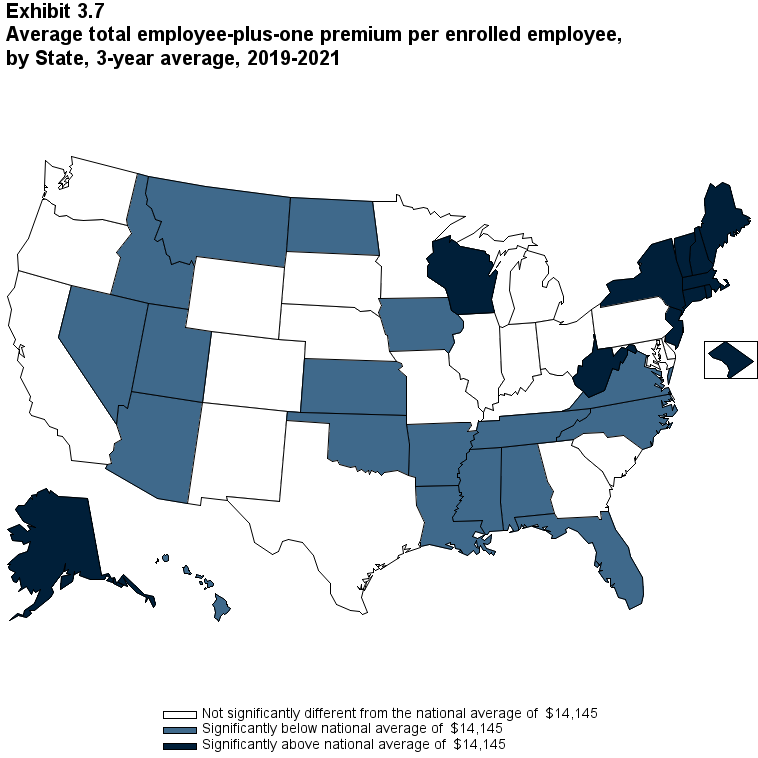
Exhibit 3.7 Average total employee-plus-one premium (standard error) per enrolled employee, by State, 3-year average, 2019-2021
| Alabama | $13,199* | Kentucky | $14,238 | North Dakota | $13,649* |
| (Standard Error) | ($253) | (Standard Error) | ($271) | (Standard Error) | ($189) |
| Alaska | $17,229* | Louisiana | $13,058* | Ohio | $13,809 |
| (Standard Error) | ($296) | (Standard Error) | ($215) | (Standard Error) | ($210) |
| Arizona | $13,306* | Maine | $14,568* | Oklahoma | $13,584* |
| (Standard Error) | ($241) | (Standard Error) | ($193) | (Standard Error) | ($236) |
| Arkansas | $12,452* | Maryland | $14,662 | Oregon | $13,985 |
| (Standard Error) | ($199) | (Standard Error) | ($277) | (Standard Error) | ($257) |
| California | $14,247 | Massachusetts | $14,833* | Pennsylvania | $14,451 |
| (Standard Error) | ($233) | (Standard Error) | ($270) | (Standard Error) | ($205) |
| Colorado | $14,132 | Michigan | $14,319 | Rhode Island | $14,873* |
| (Standard Error) | ($263) | (Standard Error) | ($326) | (Standard Error) | ($242) |
| Connecticut | $15,241* | Minnesota | $14,499 | South Carolina | $14,306 |
| (Standard Error) | ($290) | (Standard Error) | ($205) | (Standard Error) | ($228) |
| Delaware | $14,015 | Mississippi | $13,196* | South Dakota | $14,316 |
| (Standard Error) | ($300) | (Standard Error) | ($254) | (Standard Error) | ($213) |
| District of Columbia | $15,252* | Missouri | $13,766 | Tennessee | $13,049* |
| (Standard Error) | ($284) | (Standard Error) | ($225) | (Standard Error) | ($202) |
| Florida | $13,587* | Montana | $13,538* | Texas | $13,952 |
| (Standard Error) | ($260) | (Standard Error) | ($231) | (Standard Error) | ($164) |
| Georgia | $13,853 | Nebraska | $14,361 | Utah | $13,007* |
| (Standard Error) | ($287) | (Standard Error) | ($224) | (Standard Error) | ($237) |
| Hawaii | $13,207* | Nevada | $12,924* | Vermont | $15,585* |
| (Standard Error) | ($297) | (Standard Error) | ($254) | (Standard Error) | ($209) |
| Idaho | $12,238* | New Hampshire | $15,732* | Virginia | $13,342* |
| (Standard Error) | ($263) | (Standard Error) | ($274) | (Standard Error) | ($228) |
| Illinois | $14,394 | New Jersey | $15,426* | Washington | $13,877 |
| (Standard Error) | ($190) | (Standard Error) | ($251) | (Standard Error) | ($252) |
| Indiana | $14,384 | New Mexico | $13,714 | West Virginia | $15,331* |
| (Standard Error) | ($217) | (Standard Error) | ($265) | (Standard Error) | ($272) |
| Iowa | $13,073* | New York | $15,957* | Wisconsin | $14,596* |
| (Standard Error) | ($196) | (Standard Error) | ($252) | (Standard Error) | ($202) |
| Kansas | $13,274* | North Carolina | $13,613* | Wyoming | $14,888 |
| (Standard Error) | ($210) | (Standard Error) | ($229) | (Standard Error) | ($377) |
| Source: Medical Expenditure Panel Survey-Insurance Component,
private-sector establishments, 2019-2021. Note: * Statistically different from national average of $14,145 at p < 0.05. Note that the standard error on the national estimate of $14,145 is $49.04. |
|||||
|---|---|---|---|---|---|
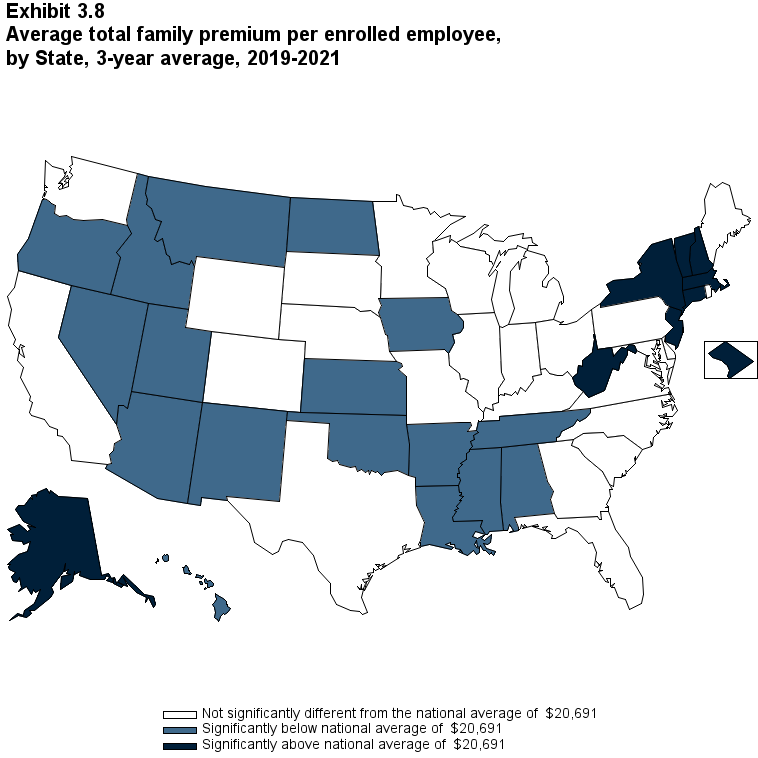
Exhibit 3.8 Average total family premium (standard error) per enrolled employee, by State, 3-year average, 2019-2021
| Alabama | $18,071* | Kentucky | $20,669 | North Dakota | $19,527* |
| (Standard Error) | ($288) | (Standard Error) | ($345) | (Standard Error) | ($224) |
| Alaska | $22,563* | Louisiana | $18,918* | Ohio | $20,079 |
| (Standard Error) | ($436) | (Standard Error) | ($347) | (Standard Error) | ($351) |
| Arizona | $19,800* | Maine | $20,832 | Oklahoma | $19,726* |
| (Standard Error) | ($390) | (Standard Error) | ($216) | (Standard Error) | ($301) |
| Arkansas | $17,570* | Maryland | $20,591 | Oregon | $19,998* |
| (Standard Error) | ($314) | (Standard Error) | ($378) | (Standard Error) | ($298) |
| California | $21,065 | Massachusetts | $21,659* | Pennsylvania | $20,503 |
| (Standard Error) | ($315) | (Standard Error) | ($300) | (Standard Error) | ($300) |
| Colorado | $20,622 | Michigan | $19,983 | Rhode Island | $21,228 |
| (Standard Error) | ($298) | (Standard Error) | ($441) | (Standard Error) | ($302) |
| Connecticut | $22,246* | Minnesota | $20,724 | South Carolina | $20,357 |
| (Standard Error) | ($362) | (Standard Error) | ($338) | (Standard Error) | ($477) |
| Delaware | $21,233 | Mississippi | $18,955* | South Dakota | $20,436 |
| (Standard Error) | ($433) | (Standard Error) | ($366) | (Standard Error) | ($271) |
| District of Columbia | $22,879* | Missouri | $20,768 | Tennessee | $18,756* |
| (Standard Error) | ($335) | (Standard Error) | ($352) | (Standard Error) | ($253) |
| Florida | $20,721 | Montana | $20,017* | Texas | $20,886 |
| (Standard Error) | ($416) | (Standard Error) | ($321) | (Standard Error) | ($252) |
| Georgia | $20,428 | Nebraska | $20,323 | Utah | $19,161* |
| (Standard Error) | ($373) | (Standard Error) | ($323) | (Standard Error) | ($257) |
| Hawaii | $18,876* | Nevada | $19,261* | Vermont | $22,170* |
| (Standard Error) | ($366) | (Standard Error) | ($359) | (Standard Error) | ($310) |
| Idaho | $19,886* | New Hampshire | $22,375* | Virginia | $20,392 |
| (Standard Error) | ($336) | (Standard Error) | ($336) | (Standard Error) | ($308) |
| Illinois | $20,924 | New Jersey | $22,182* | Washington | $20,200 |
| (Standard Error) | ($292) | (Standard Error) | ($505) | (Standard Error) | ($385) |
| Indiana | $20,681 | New Mexico | $19,346* | West Virginia | $21,788* |
| (Standard Error) | ($443) | (Standard Error) | ($427) | (Standard Error) | ($424) |
| Iowa | $19,220* | New York | $23,044* | Wisconsin | $20,822 |
| (Standard Error) | ($313) | (Standard Error) | ($300) | (Standard Error) | ($271) |
| Kansas | $19,284* | North Carolina | $20,665 | Wyoming | $21,083 |
| (Standard Error) | ($301) | (Standard Error) | ($286) | (Standard Error) | ($385) |
| Source: Medical Expenditure Panel Survey-Insurance Component,
private-sector establishments, 2019-2021. Note: * Statistically different from national average of $20,691 at p < 0.05. Note that the standard error on the national estimate of $20,691 is $68.57. |
|||||
|---|---|---|---|---|---|
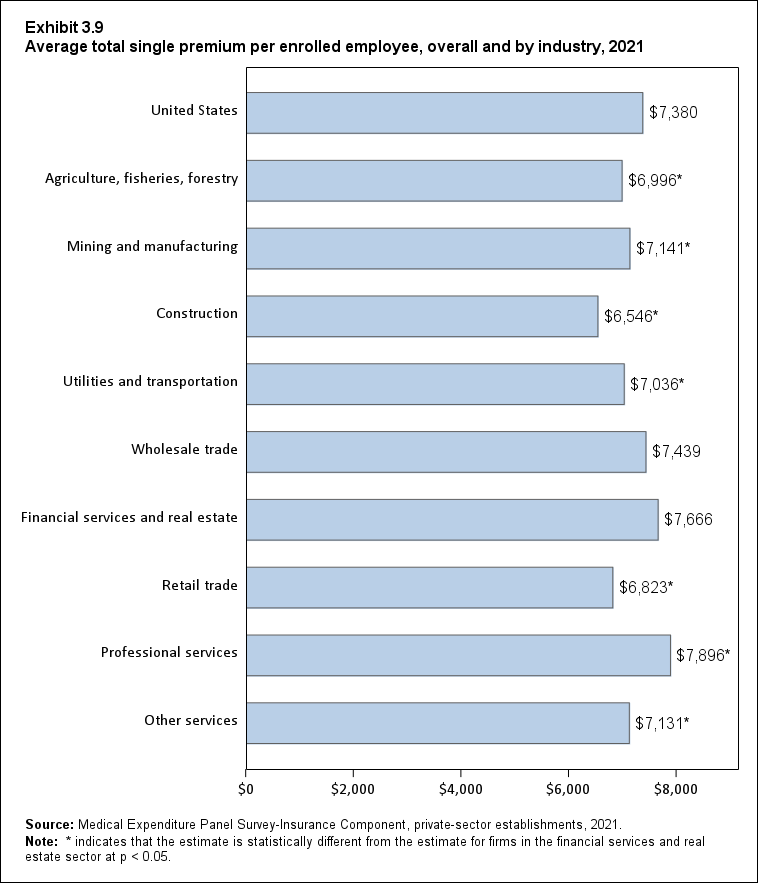
Exhibit 3.9 Average total single premium (standard error) per enrolled employee, overall and by industry, 2021
| Industry | Amount |
|---|---|
| United States | $7,380 |
| (Standard Error) | ($37) |
| Agriculture, fisheries, forestry | $6,996* |
| (Standard Error) | ($237) |
| Mining and manufacturing | $7,141* |
| (Standard Error) | ($82) |
| Construction | $6,546* |
| (Standard Error) | ($136) |
| Utilities and transportation | $7,036* |
| (Standard Error) | ($126) |
| Wholesale trade | $7,439 |
| (Standard Error) | ($267) |
| Financial services and real estate | $7,666 |
| (Standard Error) | ($81) |
| Retail trade | $6,823* |
| (Standard Error) | ($124) |
| Professional services | $7,896* |
| (Standard Error) | ($63) |
| Other services | $7,131* |
| (Standard Error) | ($79) |
| Source: Medical Expenditure Panel Survey-Insurance Component,
private-sector establishments, 2021. Note: * indicates that the estimate is statistically different from the estimate for firms in the financial services and real estate sector at p < 0.05. |
|
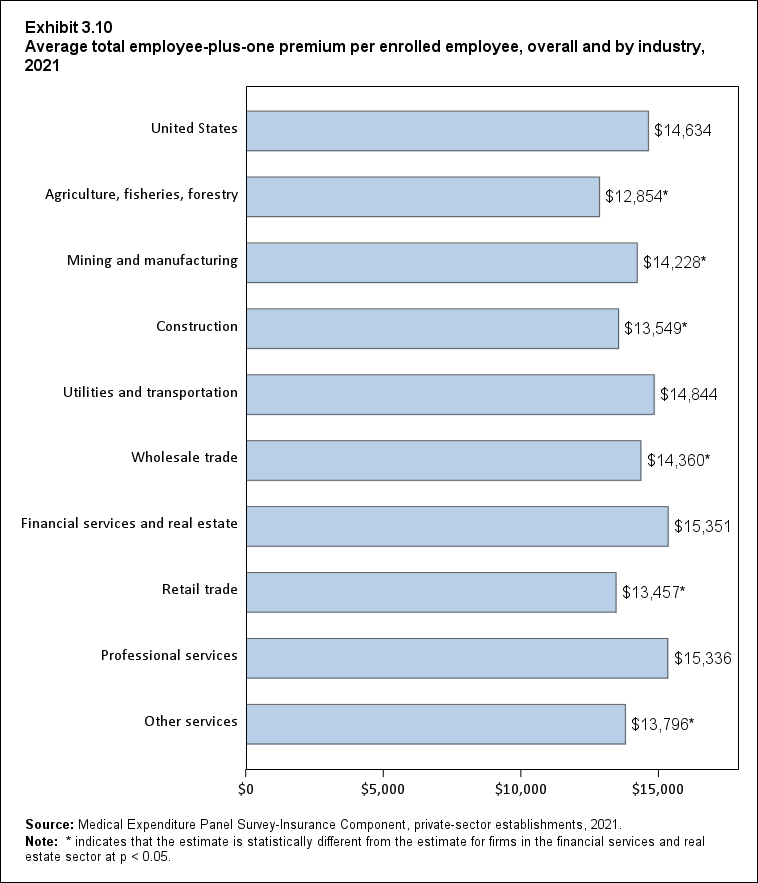
Exhibit 3.10 Average total employee-plus-one premium (standard error) per enrolled employee, overall and by industry, 2021
| Industry | Amount |
|---|---|
| United States | $14,634 |
| (Standard Error) | ($84) |
| Agriculture, fisheries, forestry | $12,854* |
| (Standard Error) | ($781) |
| Mining and manufacturing | $14,228* |
| (Standard Error) | ($178) |
| Construction | $13,549* |
| (Standard Error) | ($560) |
| Utilities and transportation | $14,844 |
| (Standard Error) | ($326) |
| Wholesale trade | $14,360* |
| (Standard Error) | ($452) |
| Financial services and real estate | $15,351 |
| (Standard Error) | ($198) |
| Retail trade | $13,457* |
| (Standard Error) | ($153) |
| Professional services | $15,336 |
| (Standard Error) | ($160) |
| Other services | $13,796* |
| (Standard Error) | ($192) |
| Source: Medical Expenditure Panel Survey-Insurance Component,
private-sector establishments, 2021. Note: * indicates that the estimate is statistically different from the estimate for firms in the financial services and real estate sector at p < 0.05. |
|
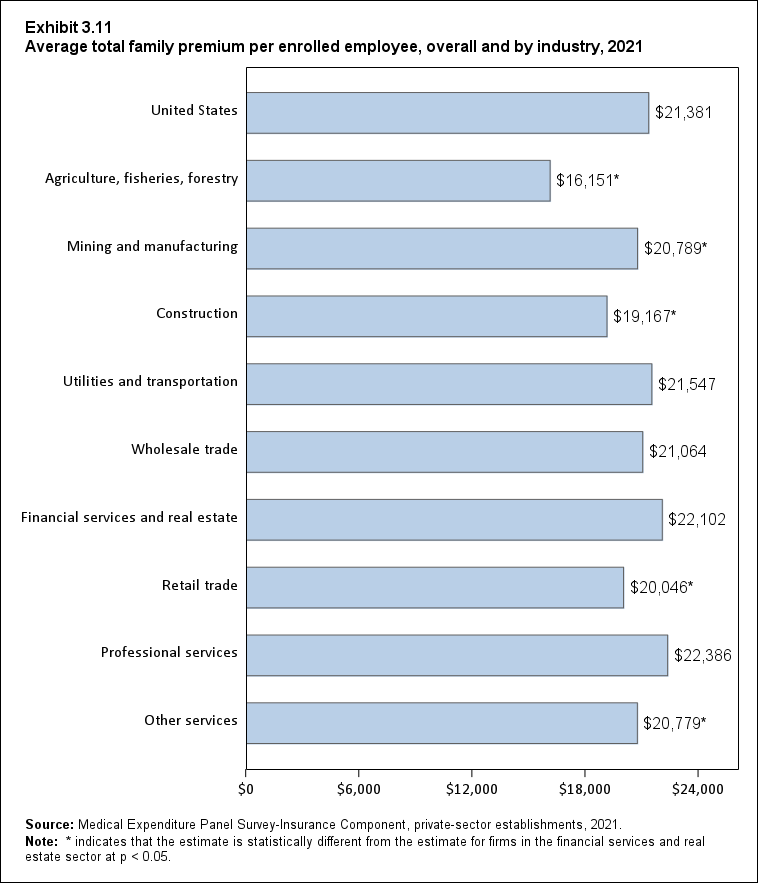
Exhibit 3.11 Average total family premium (standard error) per enrolled employee, overall and by industry, 2021
| Industry | Amount |
|---|---|
| United States | $21,381 |
| (Standard Error) | ($111) |
| Agriculture, fisheries, forestry | $16,151* |
| (Standard Error) | ($1938) |
| Mining and manufacturing | $20,789* |
| (Standard Error) | ($219) |
| Construction | $19,167* |
| (Standard Error) | ($580) |
| Utilities and transportation | $21,547 |
| (Standard Error) | ($394) |
| Wholesale trade | $21,064 |
| (Standard Error) | ($542) |
| Financial services and real estate | $22,102 |
| (Standard Error) | ($293) |
| Retail trade | $20,046* |
| (Standard Error) | ($242) |
| Professional services | $22,386 |
| (Standard Error) | ($196) |
| Other services | $20,779* |
| (Standard Error) | ($331) |
| Source: Medical Expenditure Panel Survey-Insurance Component,
private-sector establishments, 2021. Note: * indicates that the estimate is statistically different from the estimate for firms in the financial services and real estate sector at p < 0.05. |
|
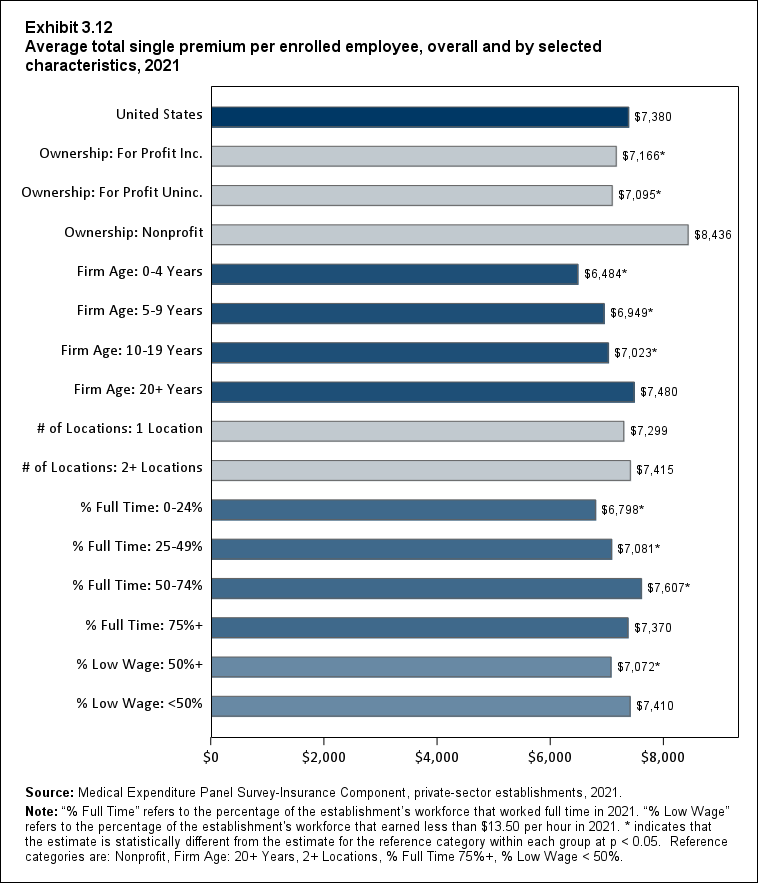
Exhibit 3.12 Average total single premium (standard error) per enrolled employee, overall and by selected characteristics, 2021
| Employer Characteristics | Amount |
|---|---|
| United States | $7,380 |
| (Standard Error) | ($37) |
| Ownership: For Profit Inc. | $7,166* |
| (Standard Error) | ($45) |
| Ownership: For Profit Uninc. | $7,095* |
| (Standard Error) | ($74) |
| Ownership: Nonprofit | $8,436 |
| (Standard Error) | ($81) |
| Firm Age: 0-4 Years | $6,484* |
| (Standard Error) | ($189) |
| Firm Age: 5-9 Years | $6,949* |
| (Standard Error) | ($169) |
| Firm Age: 10-19 Years | $7,023* |
| (Standard Error) | ($99) |
| Firm Age: 20+ Years | $7,480 |
| (Standard Error) | ($41) |
| # of Locations: 1 Location | $7,299 |
| (Standard Error) | ($70) |
| # of Locations: 2+ Locations | $7,415 |
| (Standard Error) | ($43) |
| % Full Time: 0-24% | $6,798* |
| (Standard Error) | ($255) |
| % Full Time: 25-49% | $7,081* |
| (Standard Error) | ($100) |
| % Full Time: 50-74% | $7,607* |
| (Standard Error) | ($112) |
| % Full Time: 75%+ | $7,370 |
| (Standard Error) | ($41) |
| % Low Wage: 50%+ | $7,072* |
| (Standard Error) | ($108) |
| % Low Wage: <50% | $7,410 |
| (Standard Error) | ($39) |
| Source: Medical Expenditure Panel Survey-Insurance Component,
private-sector establishments, 2021. Note: "% Full Time" refers to the percentage of the establishment's workforce that worked full time in 2021. "% Low Wage" refers to the percentage of the establishment's workforce that earned less than $13.50 per hour in 2021. * indicates that the estimate is statistically different from the estimate for the reference category within each group at p < 0.05. Reference categories are: Nonprofit, Firm Age: 20+ Years, 2+ Locations, % Full Time 75%+, % Low Wage < 50%. |
|
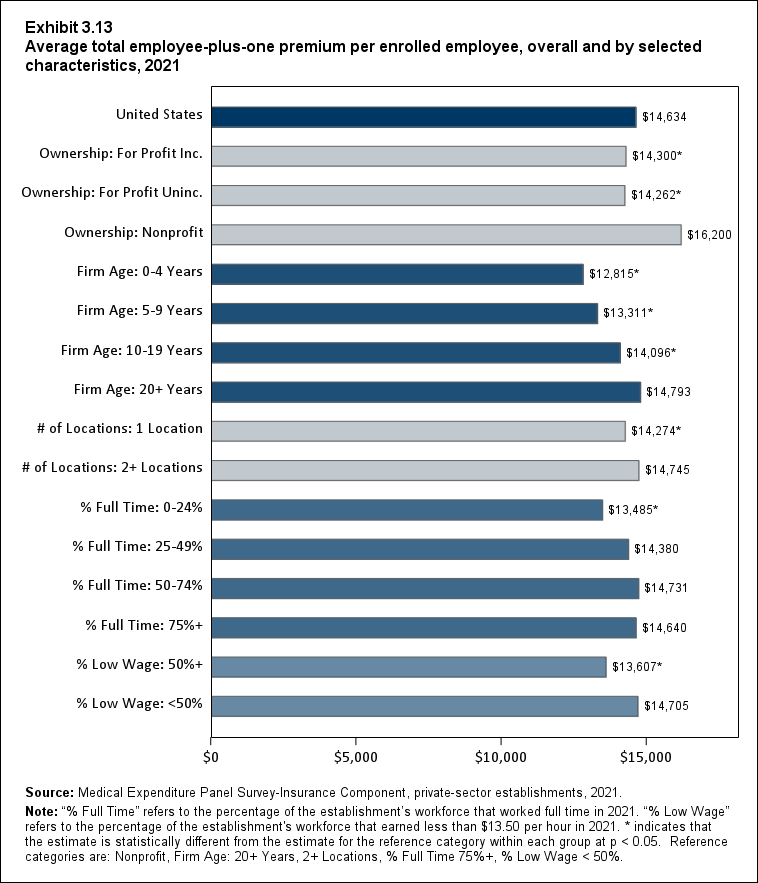
Exhibit 3.13 Average total employee-plus-one premium (standard error) per enrolled employee, overall and by selected characteristics, 2021
| Employer Characteristics | Amount |
|---|---|
| United States | $14,634 |
| (Standard Error) | ($84) |
| Ownership: For Profit Inc. | $14,300* |
| (Standard Error) | ($99) |
| Ownership: For Profit Uninc. | $14,262* |
| (Standard Error) | ($213) |
| Ownership: Nonprofit | $16,200 |
| (Standard Error) | ($196) |
| Firm Age: 0-4 Years | $12,815* |
| (Standard Error) | ($643) |
| Firm Age: 5-9 Years | $13,311* |
| (Standard Error) | ($424) |
| Firm Age: 10-19 Years | $14,096* |
| (Standard Error) | ($222) |
| Firm Age: 20+ Years | $14,793 |
| (Standard Error) | ($93) |
| # of Locations: 1 Location | $14,274* |
| (Standard Error) | ($183) |
| # of Locations: 2+ Locations | $14,745 |
| (Standard Error) | ($95) |
| % Full Time: 0-24% | $13,485* |
| (Standard Error) | ($442) |
| % Full Time: 25-49% | $14,380 |
| (Standard Error) | ($310) |
| % Full Time: 50-74% | $14,731 |
| (Standard Error) | ($282) |
| % Full Time: 75%+ | $14,640 |
| (Standard Error) | ($92) |
| % Low Wage: 50%+ | $13,607* |
| (Standard Error) | ($247) |
| % Low Wage: <50% | $14,705 |
| (Standard Error) | ($88) |
| Source: Medical Expenditure Panel Survey-Insurance Component,
private-sector establishments, 2021. Note: "% Full Time" refers to the percentage of the establishment's workforce that worked full time in 2021. "% Low Wage" refers to the percentage of the establishment's workforce that earned less than $13.50 per hour in 2021. * indicates that the estimate is statistically different from the estimate for the reference category within each group at p < 0.05. Reference categories are: Nonprofit, Firm Age: 20+ Years, 2+ Locations, % Full Time 75%+, % Low Wage < 50%. |
|
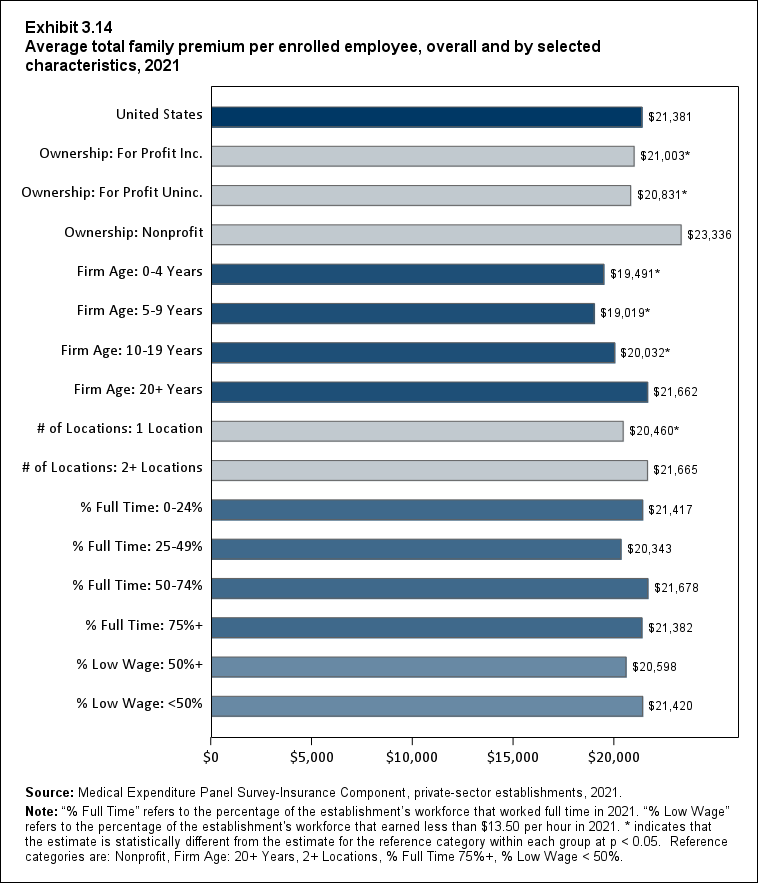
Exhibit 3.14 Average total family premium (standard error) per enrolled employee, overall and by selected characteristics, 2021
| Employer Characteristics | Amount |
|---|---|
| United States | $21,381 |
| (Standard Error) | ($111) |
| Ownership: For Profit Inc. | $21,003* |
| (Standard Error) | ($133) |
| Ownership: For Profit Uninc. | $20,831* |
| (Standard Error) | ($280) |
| Ownership: Nonprofit | $23,336 |
| (Standard Error) | ($264) |
| Firm Age: 0-4 Years | $19,491* |
| (Standard Error) | ($839) |
| Firm Age: 5-9 Years | $19,019* |
| (Standard Error) | ($710) |
| Firm Age: 10-19 Years | $20,032* |
| (Standard Error) | ($325) |
| Firm Age: 20+ Years | $21,662 |
| (Standard Error) | ($120) |
| # of Locations: 1 Location | $20,460* |
| (Standard Error) | ($252) |
| # of Locations: 2+ Locations | $21,665 |
| (Standard Error) | ($123) |
| % Full Time: 0-24% | $21,417 |
| (Standard Error) | ($984) |
| % Full Time: 25-49% | $20,343 |
| (Standard Error) | ($887) |
| % Full Time: 50-74% | $21,678 |
| (Standard Error) | ($344) |
| % Full Time: 75%+ | $21,382 |
| (Standard Error) | ($119) |
| % Low Wage: 50%+ | $20,598 |
| (Standard Error) | ($531) |
| % Low Wage: <50% | $21,420 |
| (Standard Error) | ($114) |
| Source: Medical Expenditure Panel Survey-Insurance Component,
private-sector establishments, 2021. Note: "% Full Time" refers to the percentage of the establishment's workforce that worked full time in 2021. "% Low Wage" refers to the percentage of the establishment's workforce that earned less than $13.50 per hour in 2021. * indicates that the estimate is statistically different from the estimate for the reference category within each group at p < 0.05. Reference categories are: Nonprofit, Firm Age: 20+ Years, 2+ Locations, % Full Time 75%+, % Low Wage < 50%. |
|
Exhibit 3.15 Premium distributions (standard error) for employees enrolled in single, employee-plus-one, and family coverage, overall and by firm size, 2021
| Coverage | Estimate | Total | <50 employees | 50-99 employees |
100 or more employees |
|---|---|---|---|---|---|
| Single | Average (mean) | $7,380 | $7,382 | $7,189 | $7,399 |
| (Standard Error) | ($37) | ($84) | ($129) | ($43) | |
| 10 percentile | $4,700 | $4,200* | $4,300* | $4,800 | |
| (Standard Error) | ($52) | ($94) | ($160) | ($42) | |
| 25 percentile | $5,900 | $5,300* | $5,400* | $6,000 | |
| (Standard Error) | ($28) | ($76) | ($126) | ($18) | |
| 50 percentile (median) | $7,100 | $6,900 | $6,900 | $7,100 | |
| (Standard Error) | ($31) | ($121) | ($136) | ($33) | |
| 75 percentile | $8,600 | $9,000* | $8,600 | $8,500 | |
| (Standard Error) | ($56) | ($160) | ($196) | ($59) | |
| 90 percentile | $10,000 | $11,000* | $10,000 | $10,000 | |
| (Standard Error) | ($91) | ($274) | ($211) | ($102) | |
| Employee-plus-one | Average (mean) | $14,634 | $14,326 | $14,314 | $14,703 |
| (Standard Error) | ($84) | ($262) | ($295) | ($93) | |
| 10 percentile | $9,100 | $7,200* | $8,400* | $9,600 | |
| (Standard Error) | ($144) | ($371) | ($505) | ($102) | |
| 25 percentile | $12,000 | $10,000* | $11,000* | $12,000 | |
| (Standard Error) | ($114) | ($294) | ($347) | ($144) | |
| 50 percentile (median) | $14,000 | $13,000* | $14,000 | $14,000 | |
| (Standard Error) | ($79) | ($318) | ($385) | ($100) | |
| 75 percentile | $17,000 | $18,000* | $18,000* | $17,000 | |
| (Standard Error) | ($89) | ($298) | ($414) | ($109) | |
| 90 percentile | $21,000 | $22,000* | $21,000 | $20,000 | |
| (Standard Error) | ($194) | ($368) | ($796) | ($266) | |
| Family | Average (mean) | $21,381 | $20,406* | $20,551* | $21,584 |
| (Standard Error) | ($111) | ($320) | ($396) | ($124) | |
| 10 percentile | $14,000 | $11,000* | $13,000 | $14,000 | |
| (Standard Error) | ($207) | ($594) | ($778) | ($332) | |
| 25 percentile | $17,000 | $15,000* | $16,000* | $18,000 | |
| (Standard Error) | ($147) | ($384) | ($523) | ($158) | |
| 50 percentile (median) | $21,000 | $20,000* | $20,000 | $21,000 | |
| (Standard Error) | ($84) | ($304) | ($616) | ($120) | |
| 75 percentile | $25,000 | $25,000 | $24,000* | $25,000 | |
| (Standard Error) | ($128) | ($443) | ($422) | ($142) | |
| 90 percentile | $29,000 | $30,000* | $29,000 | $29,000 | |
| (Standard Error) | ($236) | ($407) | ($877) | ($247) | |
| Source: Medical Expenditure Panel Survey-Insurance Component,
private-sector establishments, 2021. Note: * indicates that the estimates for firms with <50 and 50-99 employees are statistically different from the estimate for firms with 100+ employees at p < 0.05. |
|||||
Section 4: Employee and Employer Premium Contributions
This section presents estimates of employee and employer premium contributions for single, employee-plus-one, and family coverage, both in nominal dollars and as a percentage of total annual premiums per enrolled employee. This section also presents trends from 2009 to 2021 and provides information on employee premium contributions by firm size, State where the enrolled employees' establishment was located, industry, and other employer characteristics. In addition, this section presents the distribution of employee contributions by firm size in 2021.
In the MEPS IC, respondents are asked to report the contributions employers and employees make to total health insurance premiums. If employee-plus-one total premiums were different for employee-plus-child and employee-plus-spouse coverage, respondents were instructed to report employer and employee contributions for employee-plus-one child coverage. If total premiums for family coverage varied by family size, respondents were instructed to report the information for a family of four. If an employer's premiums varied across employees for other reasons, respondents were instructed to report for the "typical" employee.
Employee and employer premium contributions for employer-sponsored health insurance plans can vary due to (1) variation in total premiums and (2) variation in employee and employer shares of total premiums. Total premiums may vary for a number of reasons, including demographic and health characteristics of employers' workforces and employers' industry and firm size (as described in Section 3). The shares of total premiums paid by employees and employers can vary by firm size and other firm characteristics, as well as type of coverage. Employees typically pay a lower share of premiums for single coverage than for employee-plus-one and family coverage, which cover the employee and one or more dependents.
Highlights
- In 2021, enrolled employees paid on average 22.3 percent of total premiums for single coverage, 28.7 percent for employee-plus-one coverage, and 28.9 percent for family coverage. Compared with employee shares in 2020, the share for single coverage was higher, and the shares for employee-plus-one coverage and family coverage were not significantly different (Exhibit 4.1).
- In 2021, average employee and employer contributions for single coverage were $1,643 and $5,737, representing increases of 7.2 percent and 2.1 percent, respectively, over the 2020 levels (Exhibit 4.3).
- Average employee contributions in 2021 for employee-plus-one ($4,199) and family ($6,174) coverage were not significantly different from their 2020 levels. Average employer contributions in 2021 for these types of dependent coverage were $10,435 and $15,207 representing increases of 2.7 percent and 2.9 percent, respectively, over the 2020 levels (Exhibits 4.4 and 4.5).
- Average annual employee premium contributions, based on pooled 2019-2021 data, vary widely by State. These contributions ranged from $840 in Hawaii to $1,778 in Connecticut for single coverage; from $3,232 in Michigan to $4,659 in Louisiana for employee-plus-one coverage; and from $4,124 in Michigan to $6,968 in Florida for family coverage (Exhibits 4.15, 4.16, and 4.17).
- In 2021, the distribution of employee premium contributions showed substantial variation for all three coverage types. Enrolled employees at the 90th percentile of the distribution paid much larger amounts than those at the 10th percentile for single ($3,300 vs. $0), employee-plus-one ($8,200 vs. $760), and family coverage ($13,000 vs. $920) (Exhibit 4.27).
Key Trends and Differences
Variation in employee premium contributions in 2021 exhibited a number of patterns broadly consistent with those seen in previous years:
- First, in 2021, the employee share of premiums for single, employee-plus-one, and family coverage was lower at nonprofit establishments and establishments where less than 50 percent of the workforce was low wage than at other employers.
- Second, employee premium contributions showed substantial variation within and across firm size categories. The percentages of enrollees with no required premium contribution for single, employee-plus-one, and family coverage were highest at the smallest firms (fewer than 10 employees) and tended to fall as firm size increased.
- Third, employees enrolled in employee-plus-one and family coverage in small (fewer than 50 employees) and medium firms (50 to 99 employees) had higher average employee contributions, both in dollars and percentages, than those in large firms (100 or more employees). This situation occurred because employee contributions at the top end of the distribution tended to be higher in smaller firms. For example, at the 90th percentile, the employee contribution for family coverage was $16,000 at small firms, $16,000 at medium firms, and $11,000 at large firms.
- Finally, as in previous years, average annual employee contributions for 2019-2021 showed regional
variation that was not always consistent across coverage types.
- For this 3-year period, seven of the nine States in the Northeast Census region had average annual employee contributions (in dollars) that were higher than the national average for single coverage. However, no Northeastern State had higher than average employee contributions for dependent coverage.
- Also, for this 3-year period, for all three types of coverage, average annual employee contributions (in dollars) tended to be higher than or not significantly different from the national average in the Southern census region. Employee contributions tended to be lower than or not significantly different from the national average in the West.

Exhibit 4.1 Average percentage (standard error) of premium contributed by employees for single, employee-plus-one, and family coverage, 2009-2021
| Coverage | 2009 | 2010 | 2011 | 2012 | 2013 | 2014 | 2015 | 2016 | 2017 | 2018 | 2019 | 2020 | 2021 |
|---|---|---|---|---|---|---|---|---|---|---|---|---|---|
| Single | 20.5% | 20.7% | 20.9% | 20.8% | 21.0% | 21.2% | 21.1% | 21.7%* | 22.2% | 21.3%* | 21.4% | 21.4% | 22.3%* |
| (Standard Error) | (0.3%) | (0.2%) | (0.2%) | (0.3%) | (0.3%) | (0.2%) | (0.2%) | (0.2%) | (0.2%) | (0.2%) | (0.3%) | (0.2%) | (0.2%) |
| Plus One | 26.1% | 25.8% | 26.5% | 26.6% | 26.7% | 26.9% | 27.3% | 27.8% | 27.6% | 27.1% | 27.7% | 28.4% | 28.7% |
| (Standard Error) | (0.3%) | (0.3%) | (0.3%) | (0.4%) | (0.2%) | (0.3%) | (0.3%) | (0.3%) | (0.3%) | (0.3%) | (0.4%) | (0.4%) | (0.4%) |
| Family | 26.7% | 26.8% | 26.4% | 27.4%* | 27.6% | 27.1% | 27.2% | 28.0% | 27.9% | 27.8% | 28.0% | 28.8% | 28.9% |
| (Standard Error) | (0.3%) | (0.4%) | (0.3%) | (0.4%) | (0.3%) | (0.3%) | (0.3%) | (0.3%) | (0.4%) | (0.3%) | (0.4%) | (0.4%) | (0.4%) |
| Source: Medical Expenditure Panel Survey-Insurance Component,
private-sector establishments, 2009-2021. Note: * indicates the estimate is statistically different from the previous year at p < 0.05. |
|||||||||||||
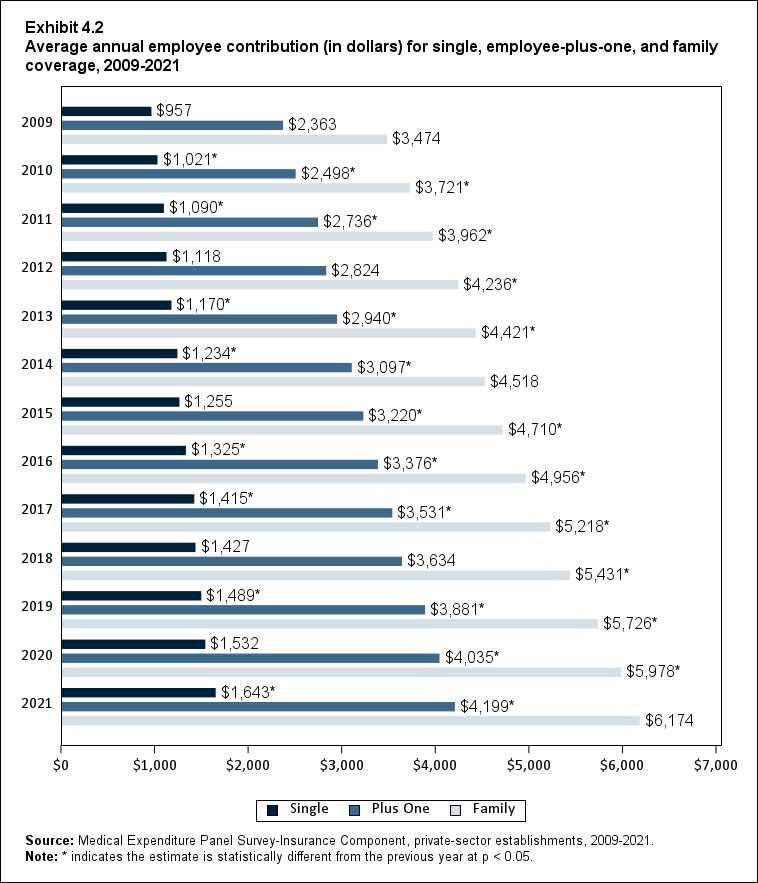
Exhibit 4.2 Average annual employee contribution (in dollars) (standard error) for single, employee-plus-one, and family coverage, 2009-2021
| Coverage | 2009 | 2010 | 2011 | 2012 | 2013 | 2014 | 2015 | 2016 | 2017 | 2018 | 2019 | 2020 | 2021 |
|---|---|---|---|---|---|---|---|---|---|---|---|---|---|
| Single | $957 | $1,021* | $1,090* | $1,118 | $1,170* | $1,234* | $1,255 | $1,325* | $1,415* | $1,427 | $1,489* | $1,532 | $1,643* |
| (Standard Error) | ($13) | ($14) | ($9) | ($14) | ($16) | ($13) | ($14) | ($13) | ($15) | ($14) | ($18) | ($16) | ($19) |
| Plus One | $2,363 | $2,498* | $2,736* | $2,824 | $2,940* | $3,097* | $3,220* | $3,376* | $3,531* | $3,634 | $3,881* | $4,035* | $4,199* |
| (Standard Error) | ($27) | ($42) | ($36) | ($46) | ($23) | ($40) | ($35) | ($36) | ($39) | ($39) | ($54) | ($52) | ($64) |
| Family | $3,474 | $3,721* | $3,962* | $4,236* | $4,421* | $4,518 | $4,710* | $4,956* | $5,218* | $5,431* | $5,726* | $5,978* | $6,174 |
| (Standard Error) | ($44) | ($53) | ($42) | ($69) | ($50) | ($48) | ($56) | ($56) | ($64) | ($63) | ($82) | ($76) | ($87) |
| Source: Medical Expenditure Panel Survey-Insurance Component,
private-sector establishments, 2009-2021. Note: * indicates the estimate is statistically different from the previous year at p < 0.05. |
|||||||||||||

Exhibit 4.3 Average annual employee contribution, employer contribution, and total premium (standard error) for single coverage, 2009-2021
| Type of Premium | 2009 | 2010 | 2011 | 2012 | 2013 | 2014 | 2015 | 2016 | 2017 | 2018 | 2019 | 2020 | 2021 |
|---|---|---|---|---|---|---|---|---|---|---|---|---|---|
| Total Premium | $4,669 | $4,940 | $5,222 | $5,384 | $5,571 | $5,832 | $5,963 | $6,101 | $6,368 | $6,715 | $6,972 | $7,149 | $7,380 |
| (Standard Error) | ($21) | ($22) | ($26) | ($28) | ($23) | ($25) | ($26) | ($27) | ($28) | ($31) | ($35) | ($35) | ($37) |
| Employer Contribution | $3,713 | $3,918 | $4,132 | $4,267 | $4,401 | $4,598 | $4,708 | $4,776 | $4,953 | $5,288 | $5,483 | $5,617 | $5,737 |
| (Standard Error) | ($25) | ($19) | ($25) | ($28) | ($21) | ($25) | ($26) | ($26) | ($29) | ($31) | ($36) | ($35) | ($36) |
| Employee Contribution | $957 | $1,021 | $1,090 | $1,118 | $1,170 | $1,234 | $1,255 | $1,325 | $1,415 | $1,427 | $1,489 | $1,532 | $1,643 |
| (Standard Error) | ($13) | ($14) | ($9) | ($14) | ($16) | ($13) | ($14) | ($13) | ($15) | ($14) | ($18) | ($16) | ($19) |
| Source: Medical Expenditure Panel Survey-Insurance Component,
private-sector establishments, 2009-2021. Note: The sum of employee and employer contributions may not exactly equal the total premium due to rounding. |
|||||||||||||
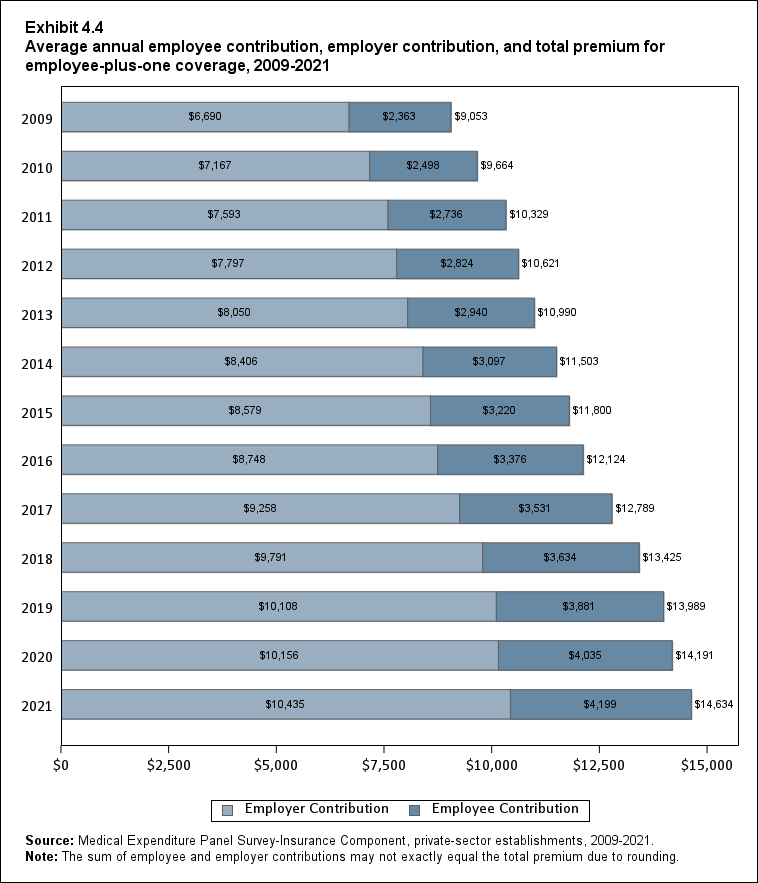
Exhibit 4.4 Average annual employee contribution, employer contribution, and total premium (standard error) for employee-plus-one coverage, 2009-2021
| Type of Premium | 2009 | 2010 | 2011 | 2012 | 2013 | 2014 | 2015 | 2016 | 2017 | 2018 | 2019 | 2020 | 2021 |
|---|---|---|---|---|---|---|---|---|---|---|---|---|---|
| Total Premium | $9,053 | $9,664 | $10,329 | $10,621 | $10,990 | $11,503 | $11,800 | $12,124 | $12,789 | $13,425 | $13,989 | $14,191 | $14,634 |
| (Standard Error) | ($34) | ($60) | ($105) | ($56) | ($54) | ($60) | ($58) | ($60) | ($70) | ($70) | ($83) | ($93) | ($84) |
| Employer Contribution | $6,690 | $7,167 | $7,593 | $7,797 | $8,050 | $8,406 | $8,579 | $8,748 | $9,258 | $9,791 | $10,108 | $10,156 | $10,435 |
| (Standard Error) | ($44) | ($40) | ($95) | ($45) | ($55) | ($65) | ($57) | ($61) | ($75) | ($70) | ($93) | ($99) | ($79) |
| Employee Contribution | $2,363 | $2,498 | $2,736 | $2,824 | $2,940 | $3,097 | $3,220 | $3,376 | $3,531 | $3,634 | $3,881 | $4,035 | $4,199 |
| (Standard Error) | ($27) | ($42) | ($36) | ($46) | ($23) | ($40) | ($35) | ($36) | ($39) | ($39) | ($54) | ($52) | ($64) |
| Source: Medical Expenditure Panel Survey-Insurance Component,
private-sector establishments, 2009-2021. Note: The sum of employee and employer contributions may not exactly equal the total premium due to rounding. |
|||||||||||||
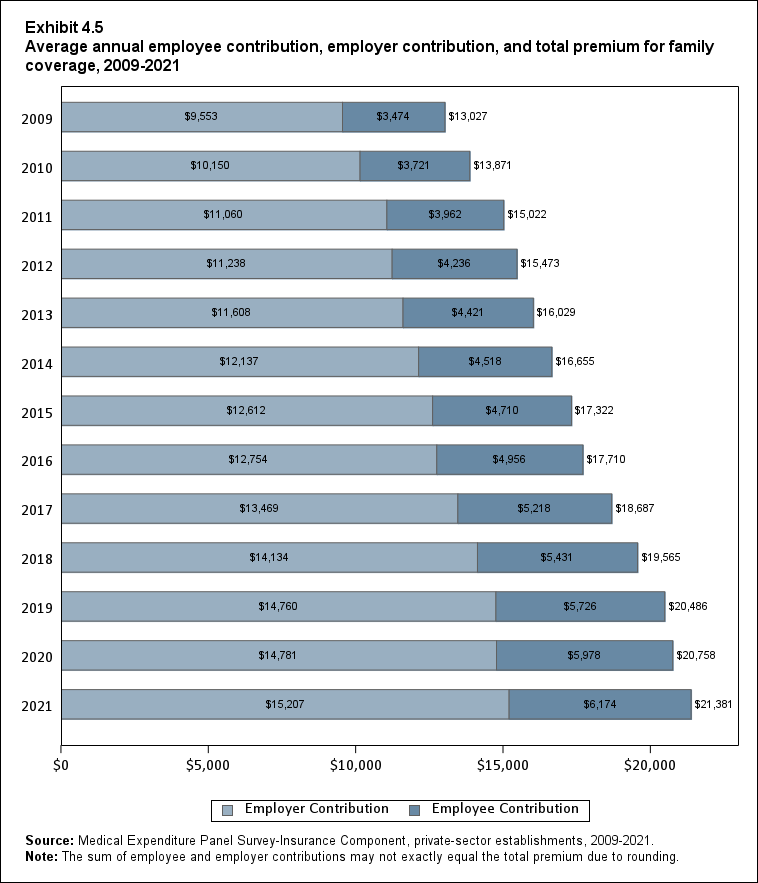
Exhibit 4.5 Average annual employee contribution, employer contribution, and total premium (standard error) for family coverage, 2009-2021
| Type of Premium | 2009 | 2010 | 2011 | 2012 | 2013 | 2014 | 2015 | 2016 | 2017 | 2018 | 2019 | 2020 | 2021 |
|---|---|---|---|---|---|---|---|---|---|---|---|---|---|
| Total Premium | $13,027 | $13,871 | $15,022 | $15,473 | $16,029 | $16,655 | $17,322 | $17,710 | $18,687 | $19,565 | $20,486 | $20,758 | $21,381 |
| (Standard Error) | ($25) | ($75) | ($98) | ($95) | ($61) | ($79) | ($95) | ($84) | ($105) | ($104) | ($125) | ($124) | ($111) |
| Employer Contribution | $9,553 | $10,150 | $11,060 | $11,238 | $11,608 | $12,137 | $12,612 | $12,754 | $13,469 | $14,134 | $14,760 | $14,781 | $15,207 |
| (Standard Error) | ($48) | ($94) | ($98) | ($74) | ($48) | ($82) | ($94) | ($90) | ($113) | ($110) | ($132) | ($139) | ($116) |
| Employee Contribution | $3,474 | $3,721 | $3,962 | $4,236 | $4,421 | $4,518 | $4,710 | $4,956 | $5,218 | $5,431 | $5,726 | $5,978 | $6,174 |
| (Standard Error) | ($44) | ($53) | ($42) | ($69) | ($50) | ($48) | ($56) | ($56) | ($64) | ($63) | ($82) | ($76) | ($87) |
| Source: Medical Expenditure Panel Survey-Insurance Component,
private-sector establishments, 2009-2021. Note: The sum of employee and employer contributions may not exactly equal the total premium due to rounding. |
|||||||||||||
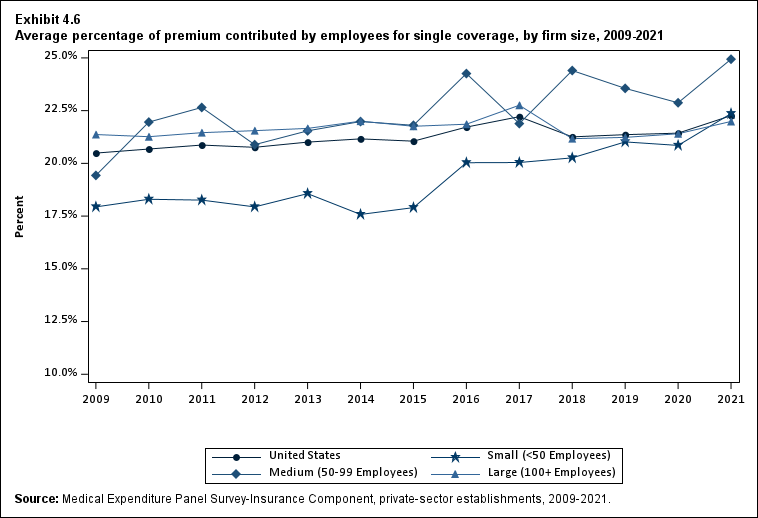
Exhibit 4.6 Average percentage (standard error) of premium contributed by employees for single coverage by firm size, 2009-2021
| Number of Employees | 2009 | 2010 | 2011 | 2012 | 2013 | 2014 | 2015 | 2016 | 2017 | 2018 | 2019 | 2020 | 2021 |
|---|---|---|---|---|---|---|---|---|---|---|---|---|---|
| U.S. | 20.5% | 20.7% | 20.9% | 20.8% | 21.0% | 21.2% | 21.1% | 21.7%* | 22.2% | 21.3%* | 21.4% | 21.4% | 22.3%* |
| (Standard Error) | (0.3%) | (0.2%) | (0.2%) | (0.3%) | (0.3%) | (0.2%) | (0.2%) | (0.2%) | (0.2%) | (0.2%) | (0.3%) | (0.2%) | (0.2%) |
| <50 | 17.9% | 18.3% | 18.3% | 17.9% | 18.6% | 17.6% | 17.9% | 20.0%* | 20.0% | 20.3% | 21.0% | 20.9% | 22.4% |
| (Standard Error) | (0.3%) | (0.6%) | (0.4%) | (0.4%) | (0.4%) | (0.5%) | (0.5%) | (0.5%) | (0.5%) | (0.6%) | (0.6%) | (0.6%) | (0.7%) |
| 50-99 | 19.4% | 22.0% | 22.7% | 20.9% | 21.5% | 22.0% | 21.8% | 24.3% | 21.9% | 24.4%* | 23.6% | 22.9% | 24.9%^ |
| (Standard Error) | (1.3%) | (0.8%) | (1.2%) | (0.7%) | (1.0%) | (1.0%) | (1.1%) | (1.0%) | (0.9%) | (0.9%) | (1.0%) | (0.9%) | (1.1%) |
| 100+ | 21.4% | 21.3% | 21.5% | 21.6% | 21.7% | 22.0% | 21.8% | 21.9% | 22.8%* | 21.2%* | 21.2% | 21.4% | 22.0% |
| (Standard Error) | (0.4%) | (0.4%) | (0.2%) | (0.3%) | (0.2%) | (0.2%) | (0.3%) | (0.2%) | (0.3%) | (0.2%) | (0.3%) | (0.3%) | (0.3%) |
| Source: Medical Expenditure Panel Survey-Insurance Component,
private-sector establishments, 2009-2021. Note: * indicates the estimate is statistically different from the previous year at p < 0.05. ^ indicates that the estimates for firms with <50 and 50-99 employees are statistically different from the estimate for firms with 100+ employees at p < 0.05. This test is conducted for 2021 only. |
|||||||||||||
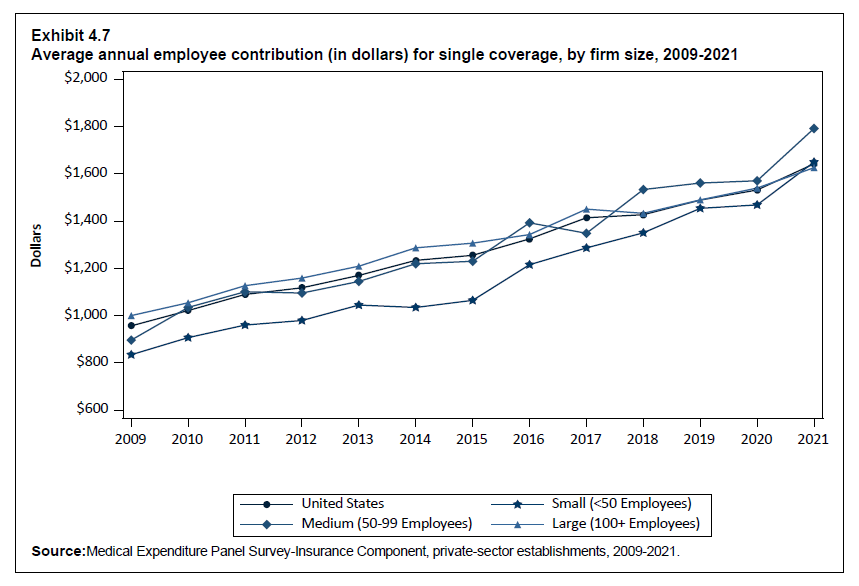
Exhibit 4.7 Average annual employee contribution (in dollars) (standard error) for single coverage, by firm size, 2009-2021
| Number of Employees | 2009 | 2010 | 2011 | 2012 | 2013 | 2014 | 2015 | 2016 | 2017 | 2018 | 2019 | 2020 | 2021 |
|---|---|---|---|---|---|---|---|---|---|---|---|---|---|
| U.S. | $957 | $1,021* | $1,090* | $1,118 | $1,170* | $1,234* | $1,255 | $1,325* | $1,415* | $1,427 | $1,489* | $1,532 | $1,643* |
| (Standard Error) | ($13) | ($14) | ($9) | ($14) | ($16) | ($13) | ($14) | ($13) | ($15) | ($14) | ($18) | ($16) | ($19) |
| <50 | $834 | $907* | $960 | $979 | $1,045 | $1,035 | $1,065 | $1,216* | $1,287 | $1,351 | $1,454 | $1,469 | $1,650* |
| (Standard Error) | ($12) | ($29) | ($22) | ($20) | ($27) | ($30) | ($29) | ($32) | ($34) | ($39) | ($43) | ($43) | ($47) |
| 50-99 | $896 | $1,035* | $1,101 | $1,096 | $1,145 | $1,220 | $1,230 | $1,393 | $1,349 | $1,534* | $1,561 | $1,571 | $1,793* |
| (Standard Error) | ($57) | ($34) | ($64) | ($37) | ($59) | ($57) | ($65) | ($60) | ($50) | ($51) | ($69) | ($60) | ($89) |
| 100+ | $1,000 | $1,054* | $1,127* | $1,159 | $1,209* | $1,287* | $1,307 | $1,343 | $1,451* | $1,433 | $1,490* | $1,540 | $1,627* |
| (Standard Error) | ($16) | ($20) | ($9) | ($16) | ($13) | ($15) | ($17) | ($15) | ($18) | ($16) | ($21) | ($18) | ($21) |
| Source: Medical Expenditure Panel Survey-Insurance Component,
private-sector establishments, 2009-2021. Note: * indicates the estimate is statistically different from the previous year at p < 0.05. ^ indicates that the estimates for firms with <50 and 50-99 employees are statistically different from the estimate for firms with 100+ employees at p < 0.05. This test is conducted for 2021 only. |
|||||||||||||
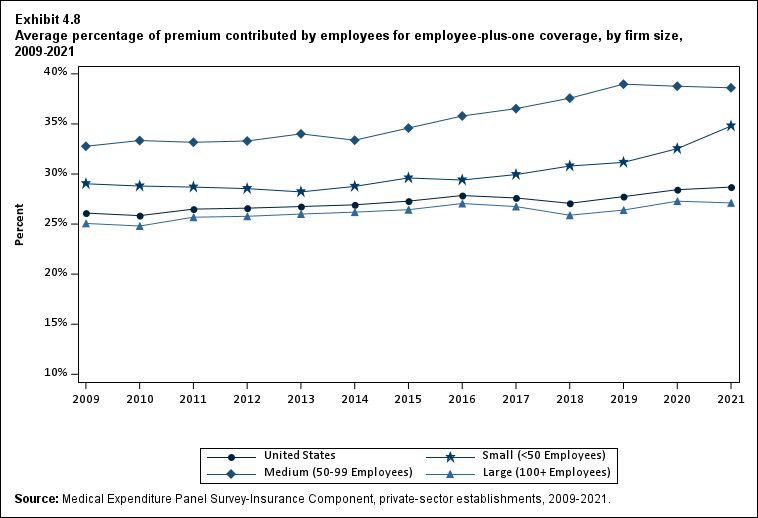
Exhibit 4.8 Average percentage (standard error) of premium contributed by employees for employee-plus-one coverage, by firm size, 2009-2021
| Number of Employees | 2009 | 2010 | 2011 | 2012 | 2013 | 2014 | 2015 | 2016 | 2017 | 2018 | 2019 | 2020 | 2021 |
|---|---|---|---|---|---|---|---|---|---|---|---|---|---|
| U.S. | 26.1% | 25.8% | 26.5% | 26.6% | 26.7% | 26.9% | 27.3% | 27.8% | 27.6% | 27.1% | 27.7% | 28.4% | 28.7% |
| (Standard Error) | (0.3%) | (0.3%) | (0.3%) | (0.4%) | (0.2%) | (0.3%) | (0.3%) | (0.3%) | (0.3%) | (0.3%) | (0.4%) | (0.4%) | (0.4%) |
| <50 | 29.0% | 28.8% | 28.7% | 28.5% | 28.2% | 28.8% | 29.6% | 29.4% | 29.9% | 30.8% | 31.2% | 32.5% | 34.8%^ |
| (Standard Error) | (1.0%) | (0.8%) | (0.8%) | (0.9%) | (1.0%) | (0.8%) | (0.9%) | (0.9%) | (1.0%) | (0.9%) | (1.2%) | (1.2%) | (1.7%) |
| 50-99 | 32.8% | 33.3% | 33.2% | 33.3% | 34.0% | 33.4% | 34.6% | 35.8% | 36.5% | 37.6% | 39.0% | 38.8% | 38.6%^ |
| (Standard Error) | (0.9%) | (1.5%) | (0.7%) | (0.8%) | (1.0%) | (1.4%) | (1.5%) | (1.3%) | (1.3%) | (1.3%) | (2.2%) | (1.3%) | (1.3%) |
| 100+ | 25.1% | 24.8% | 25.7% | 25.8% | 26.0% | 26.2% | 26.4% | 27.0% | 26.7% | 25.9% | 26.4% | 27.3% | 27.1% |
| (Standard Error) | (0.4%) | (0.4%) | (0.4%) | (0.4%) | (0.3%) | (0.4%) | (0.3%) | (0.3%) | (0.3%) | (0.3%) | (0.4%) | (0.4%) | (0.4%) |
| Source: Medical Expenditure Panel Survey-Insurance Component,
private-sector establishments, 2009-2021. Note: * indicates the estimate is statistically different from the previous year at p < 0.05. ^ indicates that the estimates for firms with <50 and 50-99 employees are statistically different from the estimate for firms with 100+ employees at p < 0.05. This test is conducted for 2021 only. |
|||||||||||||
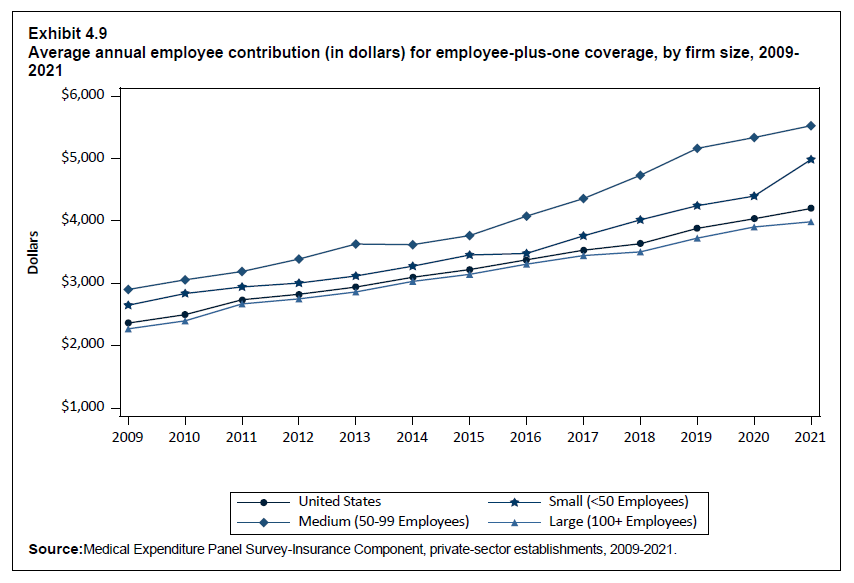
Exhibit 4.9 Average annual employee contribution (in dollars) (standard error) for employee-plus-one coverage, by firm size, 2009-2021
| Number of Employees | 2009 | 2010 | 2011 | 2012 | 2013 | 2014 | 2015 | 2016 | 2017 | 2018 | 2019 | 2020 | 2021 |
|---|---|---|---|---|---|---|---|---|---|---|---|---|---|
| U.S. | $2,363 | $2,498* | $2,736* | $2,824 | $2,940* | $3,097* | $3,220* | $3,376* | $3,531* | $3,634 | $3,881* | $4,035* | $4,199* |
| (Standard Error) | ($27) | ($42) | ($36) | ($46) | ($23) | ($40) | ($35) | ($36) | ($39) | ($39) | ($54) | ($52) | ($64) |
| <50 | $2,648 | $2,836 | $2,942 | $3,004 | $3,117 | $3,275 | $3,454 | $3,479 | $3,760 | $4,017 | $4,244 | $4,398 | $4,984^ |
| (Standard Error) | ($114) | ($84) | ($84) | ($87) | ($107) | ($95) | ($101) | ($101) | ($130) | ($120) | ($149) | ($171) | ($288) |
| 50-99 | $2,901 | $3,056 | $3,189 | $3,389 | $3,630* | $3,619 | $3,765 | $4,077 | $4,358 | $4,732 | $5,163 | $5,337 | $5,526^ |
| (Standard Error) | ($55) | ($121) | ($68) | ($87) | ($86) | ($140) | ($174) | ($131) | ($176) | ($161) | ($353) | ($196) | ($224) |
| 100+ | $2,270 | $2,398* | $2,670* | $2,751 | $2,862 | $3,031* | $3,144 | $3,307* | $3,445* | $3,504 | $3,723* | $3,903* | $3,986 |
| (Standard Error) | ($35) | ($46) | ($48) | ($49) | ($30) | ($46) | ($37) | ($40) | ($41) | ($43) | ($55) | ($56) | ($62) |
| Source: Medical Expenditure Panel Survey-Insurance Component,
private-sector establishments, 2009-2021. Note: * indicates the estimate is statistically different from the previous year at p < 0.05. ^ indicates that the estimates for firms with <50 and 50-99 employees are statistically different from the estimate for firms with 100+ employees at p < 0.05. This test is conducted for 2021 only. |
|||||||||||||
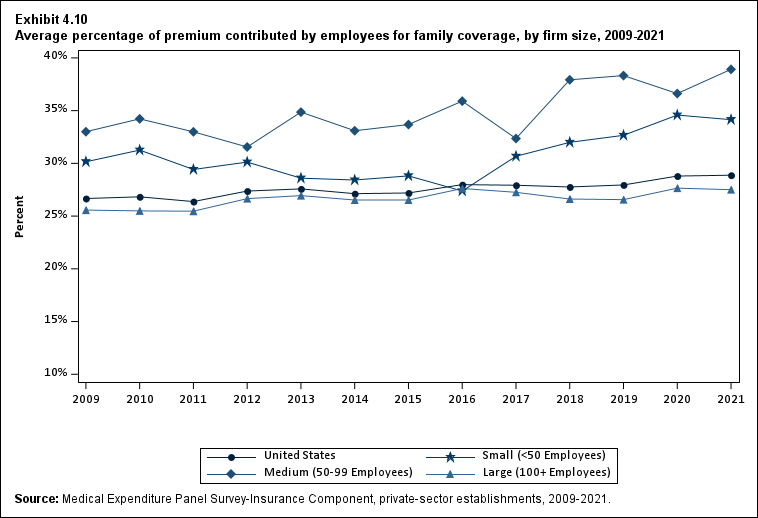
Exhibit 4.10 Average percentage of premium contributed (standard error) by employees for family coverage, by firm size, 2009-2021
| Number of Employees | 2009 | 2010 | 2011 | 2012 | 2013 | 2014 | 2015 | 2016 | 2017 | 2018 | 2019 | 2020 | 2021 |
|---|---|---|---|---|---|---|---|---|---|---|---|---|---|
| U.S. | 26.7% | 26.8% | 26.4% | 27.4%* | 27.6% | 27.1% | 27.2% | 28.0% | 27.9% | 27.8% | 28.0% | 28.8% | 28.9% |
| (Standard Error) | (0.3%) | (0.4%) | (0.3%) | (0.4%) | (0.3%) | (0.3%) | (0.3%) | (0.3%) | (0.4%) | (0.3%) | (0.4%) | (0.4%) | (0.4%) |
| <50 | 30.1% | 31.3% | 29.4% | 30.1% | 28.6% | 28.4% | 28.8% | 27.4% | 30.7%* | 32.0% | 32.7% | 34.6% | 34.1%^ |
| (Standard Error) | (0.6%) | (0.4%) | (0.9%) | (0.9%) | (1.0%) | (0.8%) | (1.0%) | (0.9%) | (1.1%) | (1.1%) | (1.1%) | (1.3%) | (1.4%) |
| 50-99 | 33.0% | 34.2% | 33.0% | 31.6% | 34.9%* | 33.1% | 33.7% | 35.9% | 32.4% | 37.9%* | 38.3% | 36.6% | 38.9%^ |
| (Standard Error) | (1.0%) | (1.7%) | (1.3%) | (0.8%) | (1.3%) | (1.3%) | (1.6%) | (1.8%) | (1.7%) | (1.9%) | (1.8%) | (2.6%) | (1.8%) |
| 100+ | 25.6% | 25.5% | 25.5% | 26.7%* | 26.9% | 26.5% | 26.5% | 27.6%* | 27.3% | 26.6% | 26.6% | 27.6% | 27.5% |
| (Standard Error) | (0.4%) | (0.5%) | (0.4%) | (0.3%) | (0.3%) | (0.3%) | (0.3%) | (0.3%) | (0.4%) | (0.3%) | (0.4%) | (0.4%) | (0.4%) |
| Source: Medical Expenditure Panel Survey-Insurance Component,
private-sector establishments, 2009-2021. Note: * indicates the estimate is statistically different from the previous year at p < 0.05. ^ indicates that the estimates for firms with <50 and 50-99 employees are statistically different from the estimate for firms with 100+ employees at p < 0.05. This test is conducted for 2021 only. |
|||||||||||||
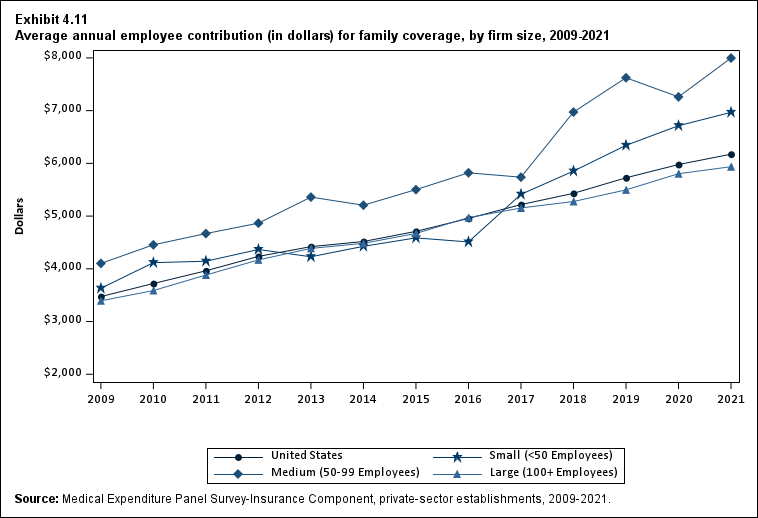
Exhibit 4.11 Average annual employee contribution (in dollars) (standard error) for family coverage, by firm size, 2009-2021
| Number of Employees | 2009 | 2010 | 2011 | 2012 | 2013 | 2014 | 2015 | 2016 | 2017 | 2018 | 2019 | 2020 | 2021 |
|---|---|---|---|---|---|---|---|---|---|---|---|---|---|
| U.S. | $3,474 | $3,721* | $3,962* | $4,236* | $4,421* | $4,518 | $4,710* | $4,956* | $5,218* | $5,431* | $5,726* | $5,978* | $6,174 |
| (Standard Error) | ($44) | ($53) | ($42) | ($69) | ($50) | ($48) | ($56) | ($56) | ($64) | ($63) | ($82) | ($76) | ($87) |
| <50 | $3,630 | $4,117* | $4,144 | $4,366 | $4,228 | $4,426 | $4,587 | $4,510 | $5,413* | $5,854 | $6,341 | $6,714 | $6,967^ |
| (Standard Error) | ($60) | ($63) | ($148) | ($135) | ($155) | ($122) | ($156) | ($146) | ($188) | ($188) | ($209) | ($271) | ($283) |
| 50-99 | $4,102 | $4,455 | $4,669 | $4,866 | $5,360* | $5,206 | $5,502 | $5,821 | $5,738 | $6,973* | $7,623 | $7,261 | $7,997^ |
| (Standard Error) | ($128) | ($196) | ($143) | ($150) | ($201) | ($220) | ($255) | ($330) | ($317) | ($336) | ($354) | ($477) | ($384) |
| 100+ | $3,393 | $3,588* | $3,882* | $4,169* | $4,387* | $4,483 | $4,671* | $4,971* | $5,154* | $5,277 | $5,497 | $5,804* | $5,937 |
| (Standard Error) | ($58) | ($60) | ($62) | ($77) | ($53) | ($54) | ($62) | ($62) | ($70) | ($68) | ($91) | ($79) | ($93) |
| Source: Medical Expenditure Panel Survey-Insurance Component,
private-sector establishments, 2009-2021. Note: * indicates the estimate is statistically different from the previous year at p < 0.05. ^ indicates that the estimates for firms with <50 and 50-99 employees are statistically different from the estimate for firms with 100+ employees at p < 0.05. This test is conducted for 2021 only. |
|||||||||||||
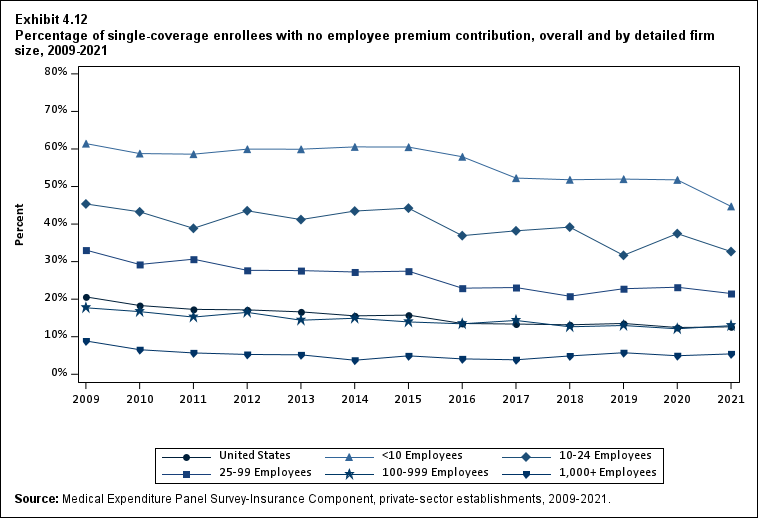
Exhibit 4.12 Percentage (standard error) of single-coverage enrollees with no employee premium contribution, overall and by detailed firm size, 2009-2021
| Number of Employees | 2009 | 2010 | 2011 | 2012 | 2013 | 2014 | 2015 | 2016 | 2017 | 2018 | 2019 | 2020 | 2021 |
|---|---|---|---|---|---|---|---|---|---|---|---|---|---|
| U.S. | 20.6% | 18.3%* | 17.3% | 17.1% | 16.6% | 15.6% | 15.8% | 13.5%* | 13.4% | 13.2% | 13.5% | 12.5% | 12.6% |
| (Standard Error) | (0.5%) | (0.7%) | (0.6%) | (0.6%) | (0.6%) | (0.4%) | (0.5%) | (0.5%) | (0.4%) | (0.4%) | (0.6%) | (0.4%) | (0.5%) |
| <10 | 61.4% | 58.8% | 58.6% | 60.0% | 59.9% | 60.6% | 60.5% | 57.9% | 52.3%* | 51.8% | 52.0% | 51.8% | 44.7%^ |
| (Standard Error) | (1.2%) | (1.6%) | (1.1%) | (1.6%) | (2.0%) | (1.6%) | (1.8%) | (1.9%) | (2.0%) | (2.0%) | (2.4%) | (2.8%) | (2.7%) |
| 10-24 | 45.4% | 43.3% | 38.9% | 43.5%* | 41.2% | 43.5% | 44.2% | 36.9%* | 38.2% | 39.2% | 31.7%* | 37.5%* | 32.7%^ |
| (Standard Error) | (1.4%) | (1.8%) | (1.5%) | (1.4%) | (1.3%) | (1.9%) | (1.9%) | (1.8%) | (2.1%) | (2.0%) | (2.0%) | (2.0%) | (2.2%) |
| 25-99 | 33.1% | 29.2% | 30.6% | 27.7% | 27.6% | 27.2% | 27.5% | 22.9%* | 23.1% | 20.8% | 22.8% | 23.2% | 21.5%^ |
| (Standard Error) | (1.6%) | (1.8%) | (1.7%) | (1.4%) | (1.3%) | (1.4%) | (1.6%) | (1.2%) | (1.3%) | (1.2%) | (1.3%) | (1.4%) | (1.4%) |
| 100-999 | 17.7% | 16.7% | 15.2% | 16.5% | 14.4% | 14.9% | 13.9% | 13.4% | 14.3% | 12.6% | 13.0% † | 12.1% | 13.0%^ |
| (Standard Error) | (1.0%) | (1.3%) | (1.4%) | (1.0%) | (0.8%) | (1.2%) | (1.1%) | (1.3%) | (1.2%) | (1.0%) | (1.2%) | (1.0%) | (1.4%) |
| 1,000+ | 8.9% | 6.5%* | 5.7% | 5.3% | 5.2% | 3.7% | 4.9%* | 4.1% | 3.9% | 4.9% | 5.7% | 4.9% | 5.4% |
| (Standard Error) | (0.7%) | (0.8%) | (0.7%) | (0.4%) | (0.8%) | (0.4%) | (0.4%) | (0.5%) | (0.4%) | (0.4%) | (1.0%) | (0.5%) | (0.5%) |
| Source: Medical Expenditure Panel Survey-Insurance Component,
private-sector establishments, 2009-2021. Note: * indicates the estimate is statistically different from the previous year at p < 0.05. ^ indicates that the estimates for firms with <10, 10-24, 25-99, and 100-999 employees are statistically different from the estimate for firms with 1,000+ employees at p < 0.05. This test is conducted for 2021 only. |
|||||||||||||
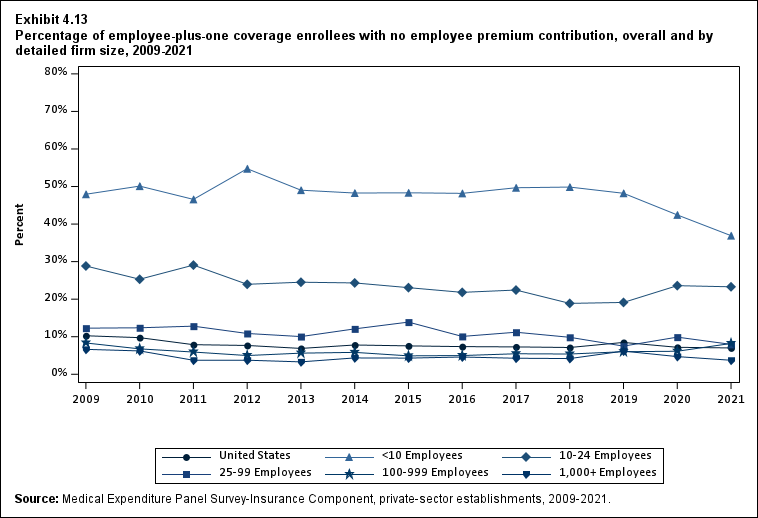
Exhibit 4.13 Percentage (standard error) of employee-plus-one coverage enrollees with no employee premium contribution, overall and by detailed firm size, 2009-2021
| Number of Employees | 2009 | 2010 | 2011 | 2012 | 2013 | 2014 | 2015 | 2016 | 2017 | 2018 | 2019 | 2020 | 2021 |
|---|---|---|---|---|---|---|---|---|---|---|---|---|---|
| U.S. | 10.3% | 9.8% | 7.9% | 7.7% | 6.9% | 7.8% | 7.6% | 7.4% | 7.3% | 7.1% | 8.5%* | 7.2% | 7.0% |
| (Standard Error) | (0.7%) | (0.9%) | (0.5%) | (0.3%) | (0.4%) | (0.4%) | (0.5%) | (0.5%) | (0.4%) | (0.4%) | (0.6%) | (0.4%) | (0.5%) |
| <10 | 47.9% | 50.1% | 46.6% | 54.7%* | 49.0% | 48.3% | 48.3% | 48.2% | 49.7% | 49.9% | 48.2% | 42.4% | 36.9%^ |
| (Standard Error) | (1.7%) | (2.0%) | (2.3%) | (2.1%) | (3.3%) | (2.7%) | (3.1%) | (3.2%) | (3.4%) | (3.3%) | (3.9%) | (4.1%) | (4.0%) |
| 10-24 | 28.8% | 25.3% | 29.1% | 24.0% | 24.5% | 24.3% | 23.1% | 21.8% | 22.4% | 18.9% | 19.1% | 23.6% | 23.3%^ |
| (Standard Error) | (1.4%) | (2.4%) | (1.9%) | (2.8%) | (3.0%) | (2.2%) | (2.3%) | (2.1%) | (2.6%) | (2.1%) | (2.7%) | (2.6%) | (3.1%) |
| 25-99 | 12.3% | 12.4% | 12.8% | 10.9% | 10.0% | 12.1% | 13.9% | 10.1%* | 11.2% | 9.8% | 7.5% | 9.9% | 8.0%^ |
| (Standard Error) | (1.5%) | (1.3%) | (1.0%) | (0.7%) | (0.7%) | (1.5%) | (1.5%) | (1.1%) | (1.5%) | (1.2%) | (1.0%) | (1.2%) | (1.1%) |
| 100-999 | 8.3% | 6.8% | 5.9% | 5.0% | 5.6% | 5.8% | 4.9% | 5.0% | 5.5% | 5.4% | 6.0% | 6.1% | 8.2%^ |
| (Standard Error) | (1.5%) | (0.9%) | (1.0%) | (1.0%) | (0.6%) | (1.1%) | (0.7%) | (1.0%) | (0.8%) | (0.8%) | (1.1%) | (1.1%) | (1.6%) |
| 1,000+ | 6.6% | 6.2% | 3.7% | 3.7% | 3.3% | 4.4% | 4.3% | 4.6% | 4.3% | 4.2% | 6.2%* | 4.7% | 3.7% |
| (Standard Error) | (0.9%) | (1.2%) | (0.7%) | (0.5%) | (0.4%) | (0.5%) | (0.6%) | (0.7%) | (0.5%) | (0.4%) | (0.7%) | (0.5%) | (0.4%) |
| Source: Medical Expenditure Panel Survey-Insurance Component,
private-sector establishments, 2009-2021. Note: * indicates the estimate is statistically different from the previous year at p < 0.05. ^ indicates that the estimates for firms with <10, 10-24, 25-99, and 100-999 employees are statistically different from the estimate for firms with 1,000+ employees at p < 0.05. This test is conducted for 2021 only. |
|||||||||||||
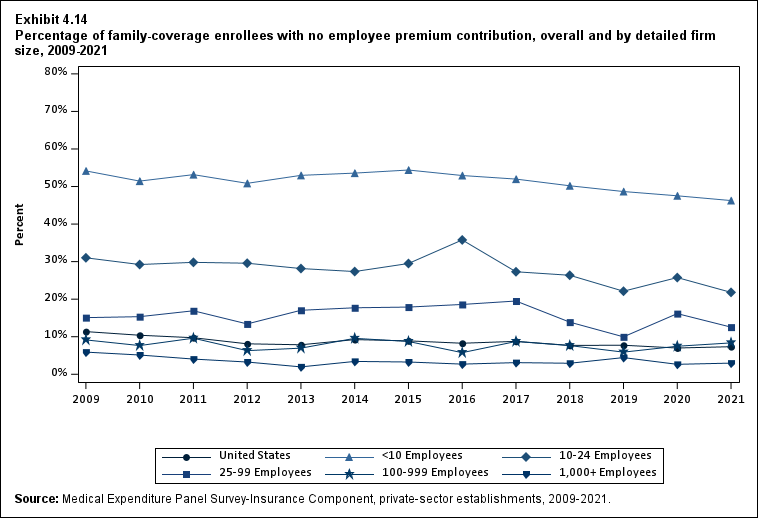
Exhibit 4.14 Percentage (standard error) of family-coverage enrollees with no employee premium contribution, overall and by detailed firm size, 2009-2021
| Number of Employees | 2009 | 2010 | 2011 | 2012 | 2013 | 2014 | 2015 | 2016 | 2017 | 2018 | 2019 | 2020 | 2021 |
|---|---|---|---|---|---|---|---|---|---|---|---|---|---|
| U.S. | 11.4% | 10.4% | 9.7% | 8.1%* | 7.9% | 9.2% | 8.9% | 8.3% | 8.8% | 7.7% | 7.7% | 7.0% | 7.3% |
| (Standard Error) | (0.7%) | (0.5%) | (0.5%) | (0.4%) | (0.6%) | (0.5%) | (0.5%) | (0.5%) | (0.6%) | (0.5%) | (0.7%) | (0.6%) | (0.5%) |
| <10 | 54.2% | 51.4% | 53.2% | 50.9% | 53.0% | 53.6% | 54.4% | 52.9% | 52.0% | 50.2% | 48.7% | 47.5% | 46.3%^ |
| (Standard Error) | (1.4%) | (0.9%) | (1.3%) | (2.7%) | (3.5%) | (2.2%) | (2.6%) | (2.7%) | (2.8%) | (3.2%) | (3.4%) | (4.1%) | (4.2%) |
| 10-24 | 31.0% | 29.2% | 29.8% | 29.6% | 28.2% | 27.4% | 29.5% | 35.8% | 27.3%* | 26.4% | 22.1% | 25.8% | 21.8%^ |
| (Standard Error) | (1.5%) | (1.6%) | (1.4%) | (2.8%) | (2.6%) | (2.2%) | (2.6%) | (2.9%) | (2.6%) | (2.5%) | (2.4%) | (2.6%) | (2.9%) |
| 25-99 | 15.1% | 15.3% | 16.9% | 13.4% | 17.0% | 17.7% | 17.9% | 18.6% | 19.5% | 13.9%* | 10.0% | 16.2%* | 12.6%^ |
| (Standard Error) | (1.9%) | (1.9%) | (1.8%) | (1.0%) | (1.7%) | (2.0%) | (2.0%) | (2.3%) | (2.3%) | (1.7%) | (1.2%) | (2.9%) | (1.8%) |
| 100-999 | 9.1% | 7.6% | 9.6% | 6.3% | 7.0% | 9.6% | 8.7% | 5.8% | 8.7% | 7.6% | 5.9% | 7.5% | 8.4%^ |
| (Standard Error) | (1.6%) | (1.2%) | (1.6%) | (0.9%) | (1.4%) | (1.3%) | (1.5%) | (0.9%) | (1.7%) | (1.2%) | (1.8%) | (1.5%) | (1.7%) |
| 1,000+ | 5.9% | 5.1% | 4.0% | 3.3% | 2.0%* | 3.4%* | 3.3% | 2.7% | 3.1% | 2.9% | 4.4% | 2.6% | 3.0% |
| (Standard Error) | (0.7%) | (0.9%) | (0.7%) | (0.5%) | (0.3%) | (0.6%) | (0.5%) | (0.6%) | (0.6%) | (0.5%) | (0.8%) | (0.6%) | (0.5%) |
| Source: Medical Expenditure Panel Survey-Insurance Component,
private-sector establishments, 2009-2021. Note: * indicates the estimate is statistically different from the previous year at p < 0.05. ^ indicates that the estimates for firms with <10, 10-24, 25-99, and 100-999 employees are statistically different from the estimate for firms with 1,000+ employees at p < 0.05. This test is conducted for 2021 only. |
|||||||||||||
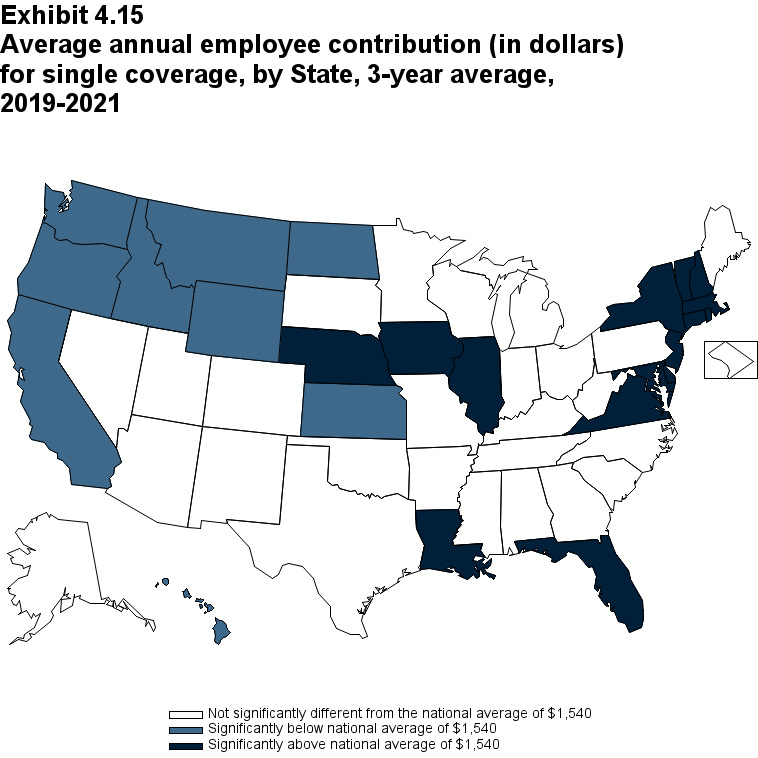
Exhibit 4.15 Average annual employee contribution (in dollars) (standard error) for single coverage, by State, 3-year average, 2019-2021
| Alabama | $1,594 | Kentucky | $1,638 | North Dakota | $1,364* |
| (Standard Error) | ($49) | (Standard Error) | ($49) | (Standard Error) | ($47) |
| Alaska | $1,475 | Louisiana | $1,726* | Ohio | $1,587 |
| (Standard Error) | ($77) | (Standard Error) | ($63) | (Standard Error) | ($44) |
| Arizona | $1,553 | Maine | $1,500 | Oklahoma | $1,444 |
| (Standard Error) | ($57) | (Standard Error) | ($44) | (Standard Error) | ($53) |
| Arkansas | $1,505 | Maryland | $1,659* | Oregon | $1,078* |
| (Standard Error) | ($51) | (Standard Error) | ($55) | (Standard Error) | ($74) |
| California | $1,380* | Massachusetts | $1,759* | Pennsylvania | $1,495 |
| (Standard Error) | ($47) | (Standard Error) | ($56) | (Standard Error) | ($49) |
| Colorado | $1,559 | Michigan | $1,456 | Rhode Island | $1,701* |
| (Standard Error) | ($67) | (Standard Error) | ($44) | (Standard Error) | ($51) |
| Connecticut | $1,778* | Minnesota | $1,467 | South Carolina | $1,598 |
| (Standard Error) | ($72) | (Standard Error) | ($39) | (Standard Error) | ($68) |
| Delaware | $1,742* | Mississippi | $1,552 | South Dakota | $1,576 |
| (Standard Error) | ($62) | (Standard Error) | ($67) | (Standard Error) | ($47) |
| District of Columbia | $1,482 | Missouri | $1,575 | Tennessee | $1,594 |
| (Standard Error) | ($54) | (Standard Error) | ($56) | (Standard Error) | ($46) |
| Florida | $1,657* | Montana | $1,188* | Texas | $1,513 |
| (Standard Error) | ($54) | (Standard Error) | ($50) | (Standard Error) | ($32) |
| Georgia | $1,550 | Nebraska | $1,730* | Utah | $1,455 |
| (Standard Error) | ($58) | (Standard Error) | ($59) | (Standard Error) | ($50) |
| Hawaii | $840* | Nevada | $1,483 | Vermont | $1,678* |
| (Standard Error) | ($47) | (Standard Error) | ($61) | (Standard Error) | ($44) |
| Idaho | $1,176* | New Hampshire | $1,727* | Virginia | $1,664* |
| (Standard Error) | ($55) | (Standard Error) | ($51) | (Standard Error) | ($59) |
| Illinois | $1,667* | New Jersey | $1,717* | Washington | $1,125* |
| (Standard Error) | ($41) | (Standard Error) | ($58) | (Standard Error) | ($64) |
| Indiana | $1,638 | New Mexico | $1,669 | West Virginia | $1,582 |
| (Standard Error) | ($51) | (Standard Error) | ($78) | (Standard Error) | ($74) |
| Iowa | $1,698* | New York | $1,677* | Wisconsin | $1,623 |
| (Standard Error) | ($63) | (Standard Error) | ($43) | (Standard Error) | ($46) |
| Kansas | $1,412* | North Carolina | $1,549 | Wyoming | $1,316* |
| (Standard Error) | ($55) | (Standard Error) | ($54) | (Standard Error) | ($58) |
| Source: Medical Expenditure Panel Survey-Insurance Component,
private-sector establishments, 2019-2021. Note: * Statistically different from the national average of $1,540 at p < 0.05. Note that the standard error on the national estimate of $1,540 is $10.17. |
|||||
|---|---|---|---|---|---|
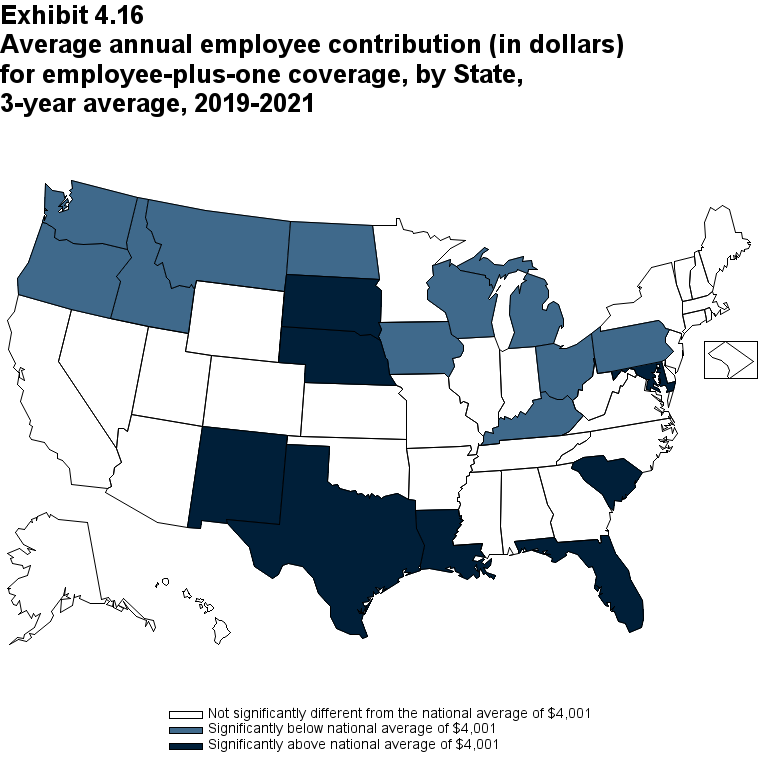
Exhibit 4.16 Average annual employee contribution (in dollars) (standard error) for employee-plus-one coverage, by State, 3-year average, 2019-2021
| Alabama | $4,032 | Kentucky | $3,633* | North Dakota | $3,674* |
| (Standard Error) | ($140) | (Standard Error) | ($136) | (Standard Error) | ($124) |
| Alaska | $4,124 | Louisiana | $4,659* | Ohio | $3,612* |
| (Standard Error) | ($172) | (Standard Error) | ($171) | (Standard Error) | ($141) |
| Arizona | $4,220 | Maine | $3,879 | Oklahoma | $4,209 |
| (Standard Error) | ($155) | (Standard Error) | ($112) | (Standard Error) | ($184) |
| Arkansas | $4,107 | Maryland | $4,330* | Oregon | $3,414* |
| (Standard Error) | ($143) | (Standard Error) | ($153) | (Standard Error) | ($147) |
| California | $4,040 | Massachusetts | $3,929 | Pennsylvania | $3,750* |
| (Standard Error) | ($146) | (Standard Error) | ($127) | (Standard Error) | ($122) |
| Colorado | $4,473 | Michigan | $3,232* | Rhode Island | $3,997 |
| (Standard Error) | ($331) | (Standard Error) | ($137) | (Standard Error) | ($116) |
| Connecticut | $4,047 | Minnesota | $4,084 | South Carolina | $4,483* |
| (Standard Error) | ($177) | (Standard Error) | ($153) | (Standard Error) | ($221) |
| Delaware | $4,224 | Mississippi | $4,388 | South Dakota | $4,422* |
| (Standard Error) | ($168) | (Standard Error) | ($215) | (Standard Error) | ($118) |
| District of Columbia | $4,184 | Missouri | $4,127 | Tennessee | $3,970 |
| (Standard Error) | ($151) | (Standard Error) | ($128) | (Standard Error) | ($173) |
| Florida | $4,641* | Montana | $3,530* | Texas | $4,238* |
| (Standard Error) | ($229) | (Standard Error) | ($158) | (Standard Error) | ($106) |
| Georgia | $3,957 | Nebraska | $4,398* | Utah | $3,712 |
| (Standard Error) | ($140) | (Standard Error) | ($137) | (Standard Error) | ($155) |
| Hawaii | $3,811 | Nevada | $4,032 | Vermont | $3,824 |
| (Standard Error) | ($198) | (Standard Error) | ($229) | (Standard Error) | ($125) |
| Idaho | $3,643* | New Hampshire | $4,203 | Virginia | $3,856 |
| (Standard Error) | ($178) | (Standard Error) | ($158) | (Standard Error) | ($132) |
| Illinois | $4,022 | New Jersey | $4,050 | Washington | $3,330* |
| (Standard Error) | ($106) | (Standard Error) | ($197) | (Standard Error) | ($222) |
| Indiana | $3,725 | New Mexico | $4,382* | West Virginia | $3,872 |
| (Standard Error) | ($180) | (Standard Error) | ($163) | (Standard Error) | ($175) |
| Iowa | $3,654* | New York | $3,744 | Wisconsin | $3,661* |
| (Standard Error) | ($115) | (Standard Error) | ($161) | (Standard Error) | ($113) |
| Kansas | $3,986 | North Carolina | $4,264 | Wyoming | $3,859 |
| (Standard Error) | ($125) | (Standard Error) | ($231) | (Standard Error) | ($237) |
| Source: Medical Expenditure Panel Survey-Insurance Component,
private-sector establishments, 2019-2021. Note: * Statistically different from the national average of $4,001 at p < 0.05. Note that the standard error on the national estimate of $4,001 is $32.61. |
|||||
|---|---|---|---|---|---|
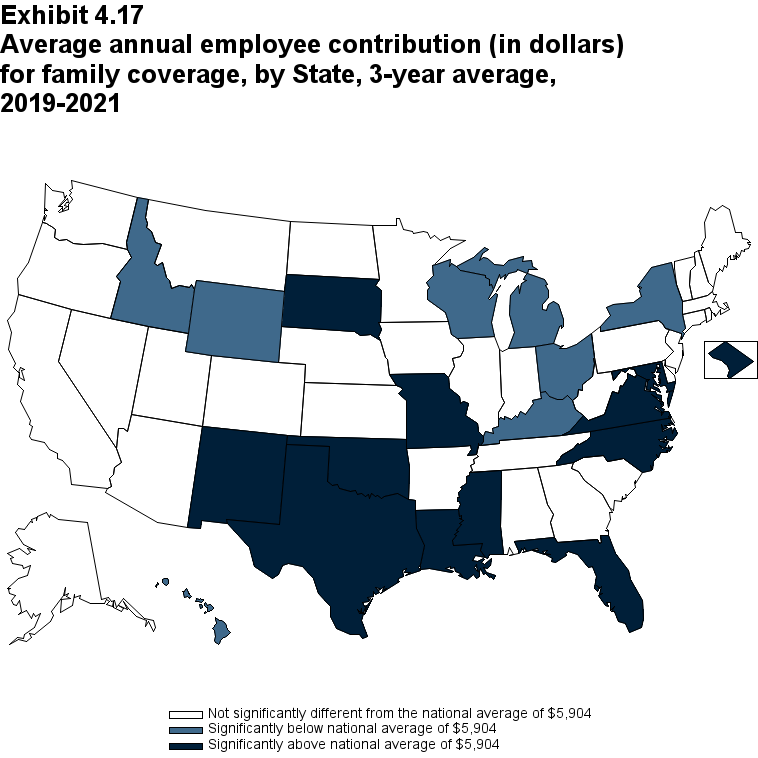
Exhibit 4.17 Average annual employee contribution (in dollars) (standard error) for family coverage, by State, 3-year average, 2019-2021
| Alabama | $5,865 | Kentucky | $5,413* | North Dakota | $5,777 |
| (Standard Error) | ($208) | (Standard Error) | ($224) | (Standard Error) | ($196) |
| Alaska | $5,537 | Louisiana | $6,934* | Ohio | $5,071* |
| (Standard Error) | ($296) | (Standard Error) | ($252) | (Standard Error) | ($208) |
| Arizona | $6,052 | Maine | $6,086 | Oklahoma | $6,483* |
| (Standard Error) | ($242) | (Standard Error) | ($165) | (Standard Error) | ($256) |
| Arkansas | $6,160 | Maryland | $6,480* | Oregon | $5,794 |
| (Standard Error) | ($238) | (Standard Error) | ($245) | (Standard Error) | ($303) |
| California | $6,018 | Massachusetts | $5,570 | Pennsylvania | $5,632 |
| (Standard Error) | ($215) | (Standard Error) | ($168) | (Standard Error) | ($215) |
| Colorado | $6,233 | Michigan | $4,124* | Rhode Island | $5,625 |
| (Standard Error) | ($300) | (Standard Error) | ($216) | (Standard Error) | ($145) |
| Connecticut | $5,696 | Minnesota | $5,489 | South Carolina | $6,827 |
| (Standard Error) | ($196) | (Standard Error) | ($212) | (Standard Error) | ($603) |
| Delaware | $6,627 | Mississippi | $6,563* | South Dakota | $6,457* |
| (Standard Error) | ($453) | (Standard Error) | ($268) | (Standard Error) | ($163) |
| District of Columbia | $6,736* | Missouri | $6,726* | Tennessee | $5,573 |
| (Standard Error) | ($276) | (Standard Error) | ($294) | (Standard Error) | ($227) |
| Florida | $6,968* | Montana | $5,332 | Texas | $6,681* |
| (Standard Error) | ($263) | (Standard Error) | ($335) | (Standard Error) | ($185) |
| Georgia | $6,103 | Nebraska | $6,247 | Utah | $5,699 |
| (Standard Error) | ($218) | (Standard Error) | ($222) | (Standard Error) | ($225) |
| Hawaii | $5,336* | Nevada | $5,954 | Vermont | $5,523 |
| (Standard Error) | ($246) | (Standard Error) | ($311) | (Standard Error) | ($234) |
| Idaho | $5,424* | New Hampshire | $5,815 | Virginia | $6,549* |
| (Standard Error) | ($211) | (Standard Error) | ($171) | (Standard Error) | ($260) |
| Illinois | $5,736 | New Jersey | $5,812 | Washington | $4,988 |
| (Standard Error) | ($166) | (Standard Error) | ($290) | (Standard Error) | ($471) |
| Indiana | $5,347 | New Mexico | $6,464* | West Virginia | $5,562 |
| (Standard Error) | ($339) | (Standard Error) | ($258) | (Standard Error) | ($342) |
| Iowa | $5,684 | New York | $5,500* | Wisconsin | $5,084* |
| (Standard Error) | ($158) | (Standard Error) | ($159) | (Standard Error) | ($157) |
| Kansas | $6,136 | North Carolina | $6,372* | Wyoming | $5,305* |
| (Standard Error) | ($232) | (Standard Error) | ($215) | (Standard Error) | ($296) |
| Source: Medical Expenditure Panel Survey-Insurance Component,
private-sector establishments, 2019-2021. Note: * Statistically different from the national average of $5,904 at p < 0.05. Note that the standard error on the national estimate of $5,904 is $46.97. |
|||||
|---|---|---|---|---|---|
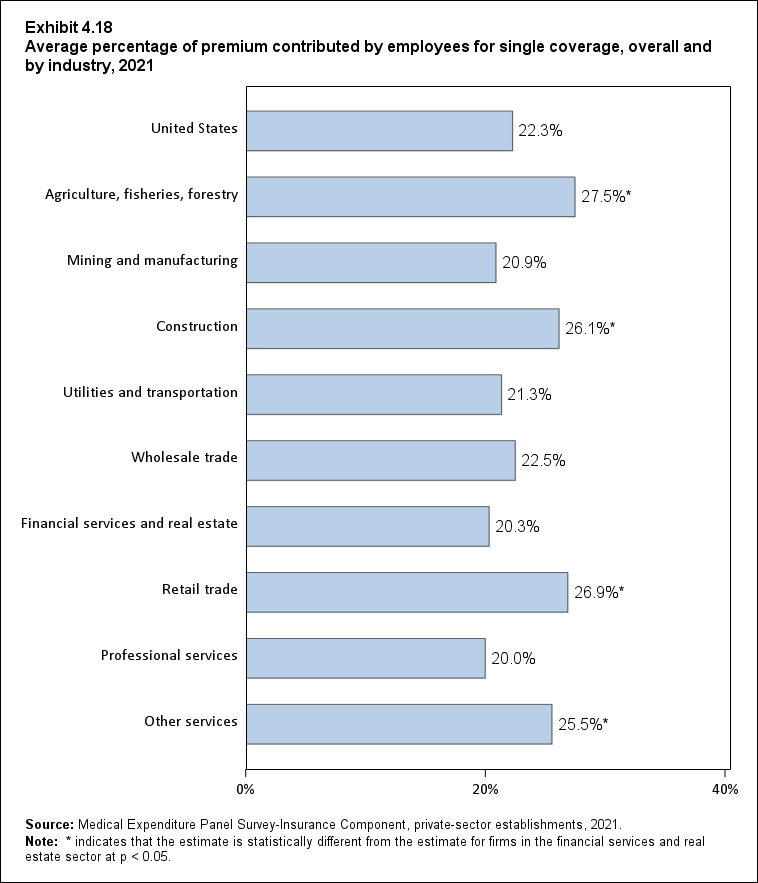
Exhibit 4.18 Average percentage (standard error) of premium contributed by employees for single coverage, overall and by industry, 2021
| Industry | Percentage |
|---|---|
| United States | 22.3% |
| (Standard Error) | (0.2%) |
| Agriculture, fisheries, forestry | 27.5%* |
| (Standard Error) | (3.2%) |
| Mining and manufacturing | 20.9% |
| (Standard Error) | (0.5%) |
| Construction | 26.1%* |
| (Standard Error) | (1.4%) |
| Utilities and transportation | 21.3% |
| (Standard Error) | (1.0%) |
| Wholesale trade | 22.5% |
| (Standard Error) | (1.1%) |
| Financial services and real estate | 20.3% |
| (Standard Error) | (0.6%) |
| Retail trade | 26.9%* |
| (Standard Error) | (0.7%) |
| Professional services | 20.0% |
| (Standard Error) | (0.4%) |
| Other services | 25.5%* |
| (Standard Error) | (0.7%) |
| Source: Medical Expenditure Panel Survey-Insurance Component,
private-sector establishments, 2021. Note: * indicates that the estimate is statistically different from the estimate for firms in the financial services and real estate sector at p < 0.05. |
|
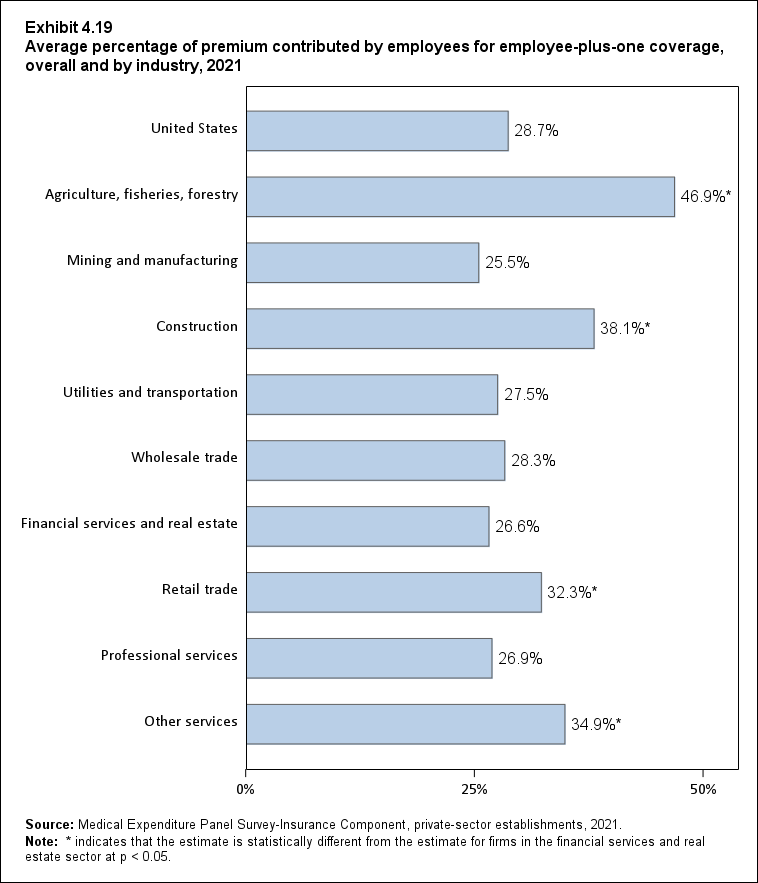
Exhibit 4.19 Average percentage (standard error) of premium contributed by employees for employee-plus-one coverage, overall and by industry, 2021
| Industry | Percentage |
|---|---|
| United States | 28.7% |
| (Standard Error) | (0.4%) |
| Agriculture, fisheries, forestry | 46.9%* |
| (Standard Error) | (4.3%) |
| Mining and manufacturing | 25.5% |
| (Standard Error) | (0.8%) |
| Construction | 38.1%* |
| (Standard Error) | (3.0%) |
| Utilities and transportation | 27.5% |
| (Standard Error) | (2.2%) |
| Wholesale trade | 28.3% |
| (Standard Error) | (1.4%) |
| Financial services and real estate | 26.6% |
| (Standard Error) | (1.0%) |
| Retail trade | 32.3%* |
| (Standard Error) | (0.9%) |
| Professional services | 26.9% |
| (Standard Error) | (0.6%) |
| Other services | 34.9%* |
| (Standard Error) | (1.1%) |
| Source: Medical Expenditure Panel Survey-Insurance Component,
private-sector establishments, 2021. Note: * indicates that the estimate is statistically different from the estimate for firms in the financial services and real estate sector at p < 0.05. |
|
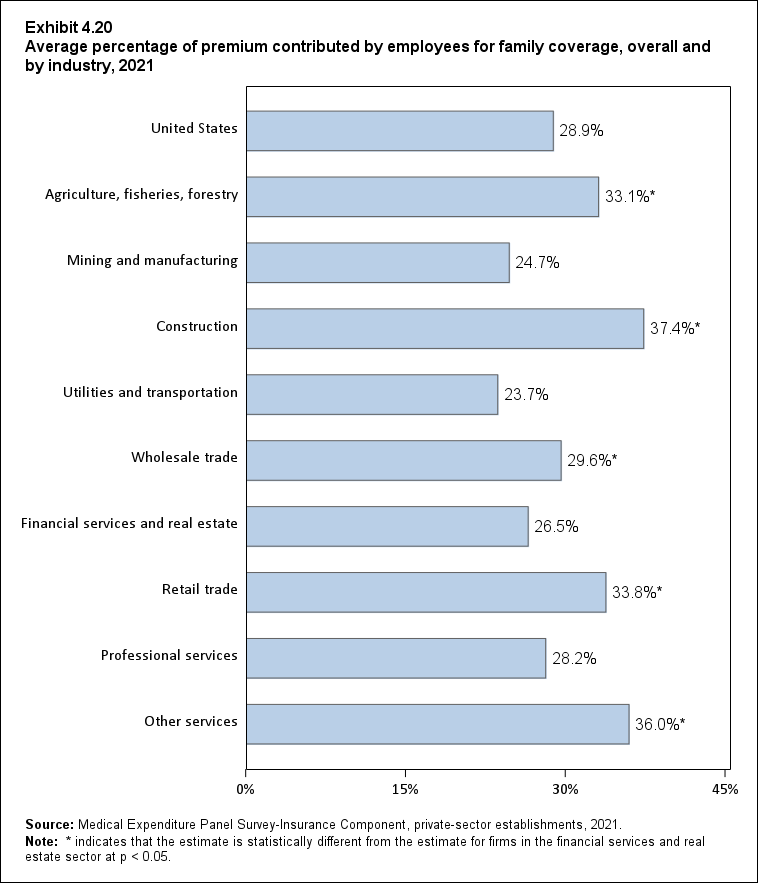
Exhibit 4.20 Average percentage (standard error) of premium contributed by employees for family coverage, overall and by industry, 2021
| Industry | Percentage |
|---|---|
| United States | 28.9% |
| (Standard Error) | (0.4%) |
| Agriculture, fisheries, forestry | 33.1%* |
| (Standard Error) | (2.7%) |
| Mining and manufacturing | 24.7% |
| (Standard Error) | (0.8%) |
| Construction | 37.4%* |
| (Standard Error) | (2.9%) |
| Utilities and transportation | 23.7% |
| (Standard Error) | (1.6%) |
| Wholesale trade | 29.6%* |
| (Standard Error) | (1.2%) |
| Financial services and real estate | 26.5% |
| (Standard Error) | (0.8%) |
| Retail trade | 33.8%* |
| (Standard Error) | (1.3%) |
| Professional services | 28.2% |
| (Standard Error) | (0.6%) |
| Other services | 36.0%* |
| (Standard Error) | (1.3%) |
| Source: Medical Expenditure Panel Survey-Insurance Component,
private-sector establishments, 2021. Note: * indicates that the estimate is statistically different from the estimate for firms in the financial services and real estate sector at p < 0.05. |
|
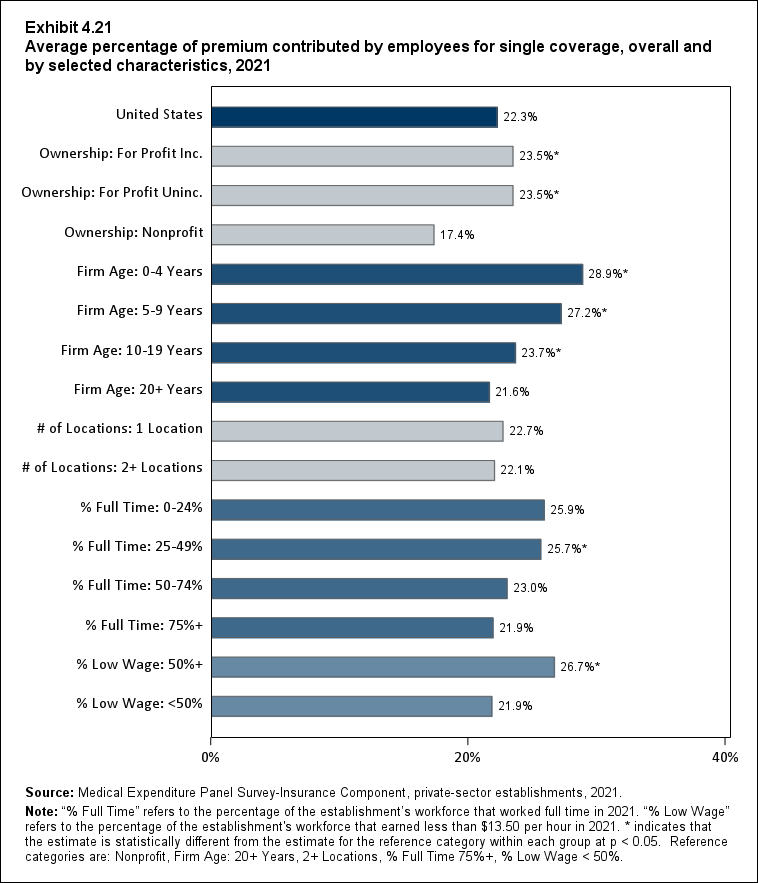
Exhibit 4.21 Average percentage (standard error) of premium contributed by employees for single coverage, overall and by selected characteristics, 2021
| Employer Characteristics | Percentage |
|---|---|
| United States | 22.3% |
| (Standard Error) | (0.2%) |
| Ownership: For Profit Inc. | 23.5%* |
| (Standard Error) | (0.3%) |
| Ownership: For Profit Uninc. | 23.5%* |
| (Standard Error) | (0.7%) |
| Ownership: Nonprofit | 17.4% |
| (Standard Error) | (0.6%) |
| Firm Age: 0-4 Years | 28.9%* |
| (Standard Error) | (2.1%) |
| Firm Age: 5-9 Years | 27.2%* |
| (Standard Error) | (1.5%) |
| Firm Age: 10-19 Years | 23.7%* |
| (Standard Error) | (0.9%) |
| Firm Age: 20+ Years | 21.6% |
| (Standard Error) | (0.3%) |
| # of Locations: 1 Location | 22.7% |
| (Standard Error) | (0.6%) |
| # of Locations: 2+ Locations | 22.1% |
| (Standard Error) | (0.3%) |
| % Full Time: 0-24% | 25.9% |
| (Standard Error) | (2.0%) |
| % Full Time: 25-49% | 25.7%* |
| (Standard Error) | (0.9%) |
| % Full Time: 50-74% | 23.0% |
| (Standard Error) | (0.9%) |
| % Full Time: 75%+ | 21.9% |
| (Standard Error) | (0.3%) |
| % Low Wage: 50%+ | 26.7%* |
| (Standard Error) | (0.7%) |
| % Low Wage: <50% | 21.9% |
| (Standard Error) | (0.3%) |
| Source: Medical Expenditure Panel Survey-Insurance Component,
private-sector establishments, 2021. Note: "% Full Time" refers to the percentage of the establishment's workforce that worked full time in 2021. "% Low Wage" refers to the percentage of the establishment's workforce that earned less than $13.50 per hour in 2021. * indicates that the estimate is statistically different from the estimate for the reference category within each group at p < 0.05. Reference categories are: Nonprofit, Firm Age: 20+ Years, 2+ Locations, % Full Time 75%+, % Low Wage < 50%. |
|
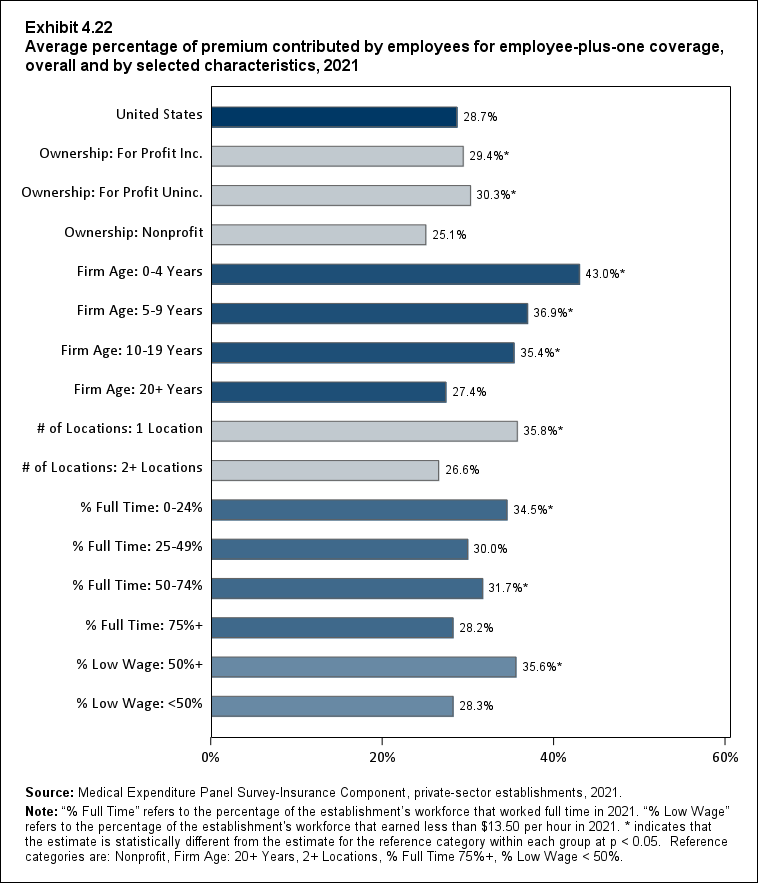
Exhibit 4.22 Average percentage (standard error) of premium contributed by employees for employee-plus-one coverage, overall and by selected characteristics, 2021
| Employer Characteristics | Percentage |
|---|---|
| United States | 28.7% |
| (Standard Error) | (0.4%) |
| Ownership: For Profit Inc. | 29.4%* |
| (Standard Error) | (0.5%) |
| Ownership: For Profit Uninc. | 30.3%* |
| (Standard Error) | (1.1%) |
| Ownership: Nonprofit | 25.1% |
| (Standard Error) | (0.9%) |
| Firm Age: 0-4 Years | 43.0%* |
| (Standard Error) | (4.9%) |
| Firm Age: 5-9 Years | 36.9%* |
| (Standard Error) | (2.9%) |
| Firm Age: 10-19 Years | 35.4%* |
| (Standard Error) | (1.1%) |
| Firm Age: 20+ Years | 27.4% |
| (Standard Error) | (0.4%) |
| # of Locations: 1 Location | 35.8%* |
| (Standard Error) | (1.1%) |
| # of Locations: 2+ Locations | 26.6% |
| (Standard Error) | (0.4%) |
| % Full Time: 0-24% | 34.5%* |
| (Standard Error) | (2.5%) |
| % Full Time: 25-49% | 30.0% |
| (Standard Error) | (1.5%) |
| % Full Time: 50-74% | 31.7%* |
| (Standard Error) | (1.7%) |
| % Full Time: 75%+ | 28.2% |
| (Standard Error) | (0.4%) |
| % Low Wage: 50%+ | 35.6%* |
| (Standard Error) | (1.1%) |
| % Low Wage: <50% | 28.3% |
| (Standard Error) | (0.4%) |
| Source: Medical Expenditure Panel Survey-Insurance Component,
private-sector establishments, 2021. Note: "% Full Time" refers to the percentage of the establishment's workforce that worked full time in 2021. "% Low Wage" refers to the percentage of the establishment's workforce that earned less than $13.50 per hour in 2021. * indicates that the estimate is statistically different from the estimate for the reference category within each group at p < 0.05. Reference categories are: Nonprofit, Firm Age: 20+ Years, 2+ Locations, % Full Time 75%+, % Low Wage < 50%. |
|
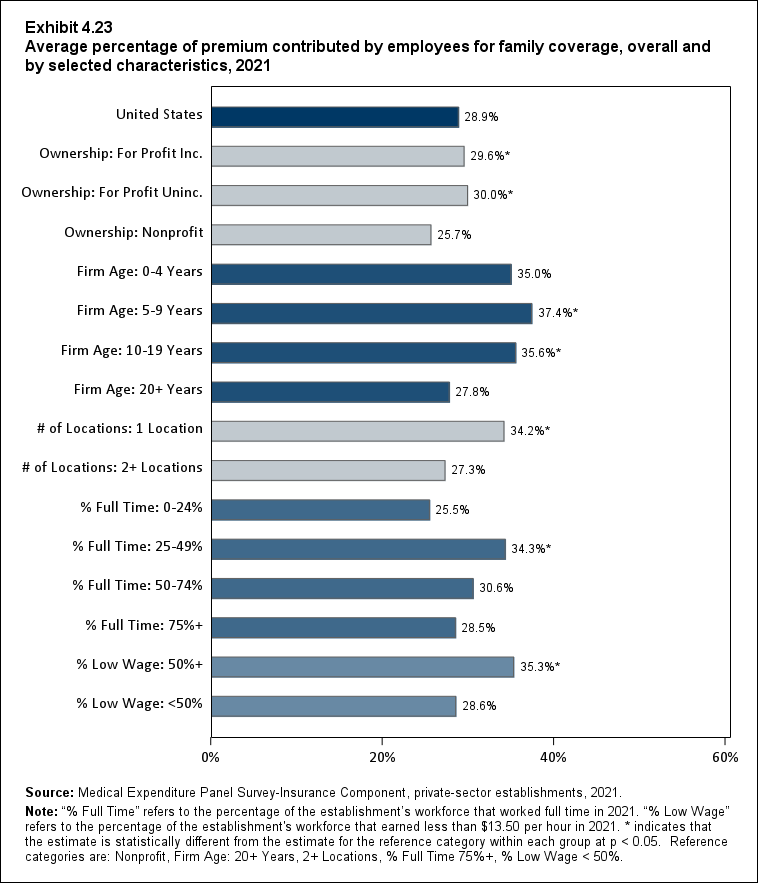
Exhibit 4.23 Average percentage (standard error) of premium contributed by employees for family coverage, overall and by selected characteristics, 2021
| Employer Characteristics | Percentage |
|---|---|
| United States | 28.9% |
| (Standard Error) | (0.4%) |
| Ownership: For Profit Inc. | 29.6%* |
| (Standard Error) | (0.5%) |
| Ownership: For Profit Uninc. | 30.0%* |
| (Standard Error) | (1.0%) |
| Ownership: Nonprofit | 25.7% |
| (Standard Error) | (0.8%) |
| Firm Age: 0-4 Years | 35.0% |
| (Standard Error) | (3.8%) |
| Firm Age: 5-9 Years | 37.4%* |
| (Standard Error) | (3.4%) |
| Firm Age: 10-19 Years | 35.6%* |
| (Standard Error) | (1.6%) |
| Firm Age: 20+ Years | 27.8% |
| (Standard Error) | (0.4%) |
| # of Locations: 1 Location | 34.2%* |
| (Standard Error) | (1.1%) |
| # of Locations: 2+ Locations | 27.3% |
| (Standard Error) | (0.4%) |
| % Full Time: 0-24% | 25.5% |
| (Standard Error) | (4.2%) |
| % Full Time: 25-49% | 34.3%* |
| (Standard Error) | (2.3%) |
| % Full Time: 50-74% | 30.6% |
| (Standard Error) | (1.4%) |
| % Full Time: 75%+ | 28.5% |
| (Standard Error) | (0.4%) |
| % Low Wage: 50%+ | 35.3%* |
| (Standard Error) | (1.5%) |
| % Low Wage: <50% | 28.6% |
| (Standard Error) | (0.4%) |
| Source: Medical Expenditure Panel Survey-Insurance Component,
private-sector establishments, 2021. Note: "% Full Time" refers to the percentage of the establishment's workforce that worked full time in 2021. "% Low Wage" refers to the percentage of the establishment's workforce that earned less than $13.50 per hour in 2021. * indicates that the estimate is statistically different from the estimate for the reference category within each group at p < 0.05. Reference categories are: Nonprofit, Firm Age: 20+ Years, 2+ Locations, % Full Time 75%+, % Low Wage < 50%. |
|
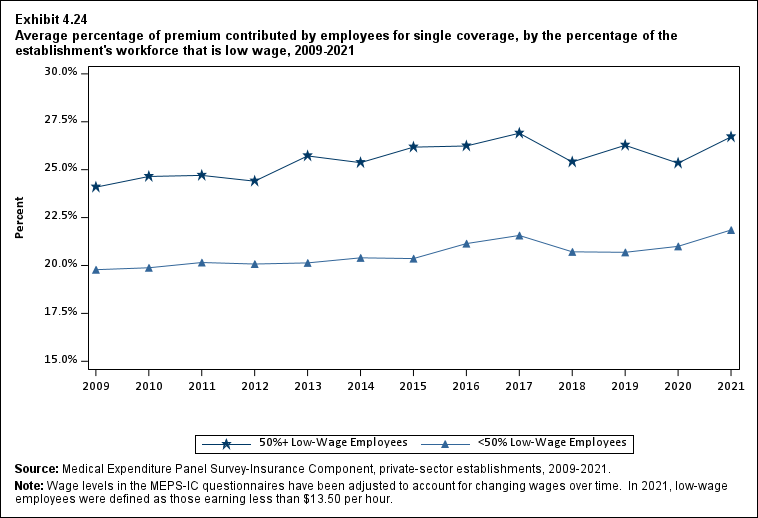
Exhibit 4.24 Average percentage (standard error) of premium contributed by enrolled employees for single coverage, by the percentage of the establishment's workforce that is low wage, 2009-2021
| Low wage | 2009 | 2010 | 2011 | 2012 | 2013 | 2014 | 2015 | 2016 | 2017 | 2018 | 2019 | 2020 | 2021 |
|---|---|---|---|---|---|---|---|---|---|---|---|---|---|
| 50%+ Low-Wage Employees | 24.1% | 24.6% | 24.7% | 24.4% | 25.7% | 25.4% | 26.2% | 26.2% | 26.9% | 25.4% | 26.3% | 25.3% | 26.7%^ |
| (Standard Error) | (0.3%) | (0.5%) | (0.8%) | (0.4%) | (0.6%) | (0.5%) | (0.8%) | (0.5%) | (0.6%) | (0.8%) | (0.7%) | (0.7%) | (0.7%) |
| <50% Low-Wage Employees | 19.8% | 19.9% | 20.2% | 20.1% | 20.1% | 20.4% | 20.4% | 21.1%* | 21.6% | 20.7%* | 20.7% | 21.0% | 21.9%* |
| (Standard Error) | (0.3%) | (0.3%) | (0.1%) | (0.3%) | (0.2%) | (0.2%) | (0.2%) | (0.2%) | (0.3%) | (0.2%) | (0.3%) | (0.2%) | (0.3%) |
| Source: Medical Expenditure Panel Survey-Insurance Component,
private-sector establishments, 2009-2021. Note: Wage levels in the MEPS-IC questionnaires have been adjusted to account for changing wages over time. In 2021, low-wage employees were defined as those earning less than $13.50 per hour. * indicates the estimate is significantly different from the previous year at p < 0.05. ^ indicates that the estimates for employers with 50%+ low wage employees are statistically different from the estimate for employers with <50% low wage employees at p < 0.05. This test is conducted for 2021 only. |
|||||||||||||
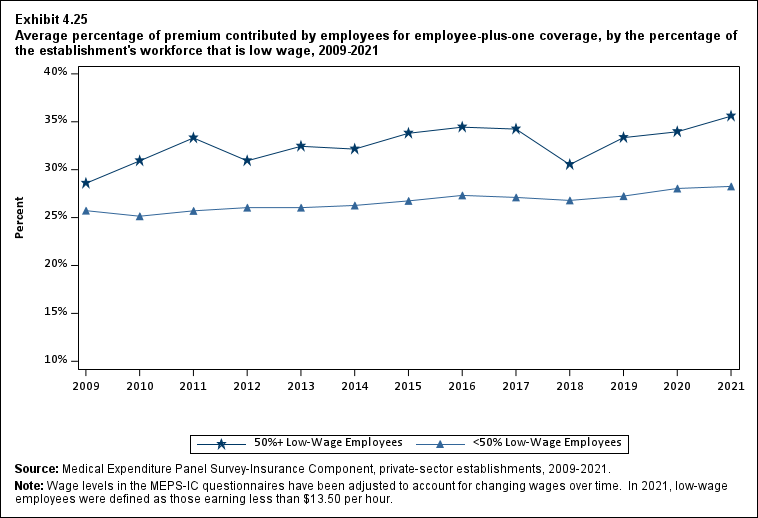
Exhibit 4.25 Average percentage (standard error) of premium contributed by enrolled employees for employee-plus-one coverage, by the percentage of the establishment's workforce that is low wage, 2009-2021
| Low wage | 2009 | 2010 | 2011 | 2012 | 2013 | 2014 | 2015 | 2016 | 2017 | 2018 | 2019 | 2020 | 2021 |
|---|---|---|---|---|---|---|---|---|---|---|---|---|---|
| 50%+ Low-Wage Employees | 28.6% | 30.9%* | 33.3%* | 30.9%* | 32.4% | 32.1% | 33.8% | 34.4% | 34.2% | 30.5%* | 33.3% | 34.0% | 35.6%^ |
| (Standard Error) | (0.8%) | (0.6%) | (0.7%) | (0.8%) | (0.6%) | (1.2%) | (1.0%) | (1.0%) | (1.1%) | (1.3%) | (1.3%) | (1.1%) | (1.1%) |
| <50% Low-Wage Employees | 25.7% | 25.1% | 25.7% | 26.0% | 26.0% | 26.3% | 26.7% | 27.3% | 27.1% | 26.8% | 27.2% | 28.0% | 28.3% |
| (Standard Error) | (0.3%) | (0.4%) | (0.3%) | (0.4%) | (0.2%) | (0.4%) | (0.3%) | (0.3%) | (0.3%) | (0.3%) | (0.4%) | (0.4%) | (0.4%) |
| Source: Medical Expenditure Panel Survey-Insurance Component,
private-sector establishments, 2009-2021. Note: Wage levels in the MEPS-IC questionnaires have been adjusted to account for changing wages over time. In 2021, low-wage employees were defined as those earning less than $13.50 per hour. * indicates the estimate is significantly different from the previous year at p < 0.05. ^ indicates that the estimates for employers with 50%+ low wage employees are statistically different from the estimate for employers with <50% low wage employees at p < 0.05. This test is conducted for 2021 only. |
|||||||||||||
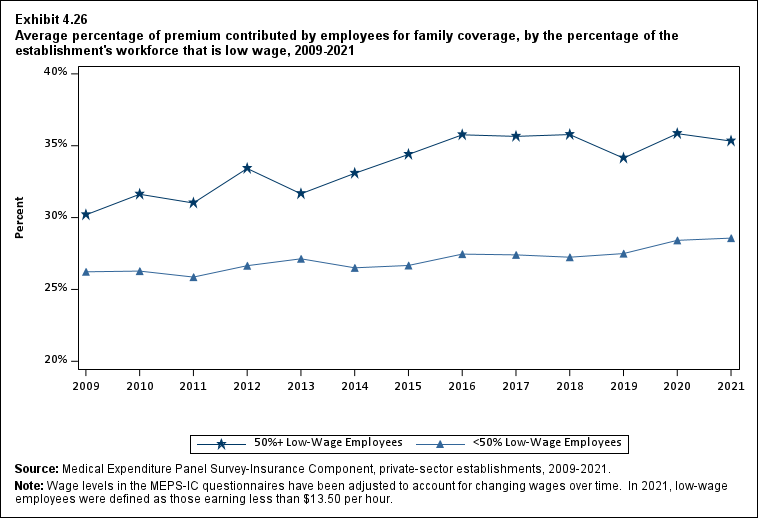
Exhibit 4.26 Average percentage (standard error) of premium contributed by employees for family coverage, by the percentage of the establishment's workforce that is low wage, 2009-2021
| Low wage | 2009 | 2010 | 2011 | 2012 | 2013 | 2014 | 2015 | 2016 | 2017 | 2018 | 2019 | 2020 | 2021 |
|---|---|---|---|---|---|---|---|---|---|---|---|---|---|
| 50%+ Low-Wage Employees | 30.2% | 31.6% | 31.0% | 33.4%* | 31.7% | 33.1% | 34.4% | 35.8% | 35.7% | 35.8% | 34.1% | 35.8% | 35.3%^ |
| (Standard Error) | (1.0%) | (0.7%) | (0.7%) | (0.6%) | (0.8%) | (0.7%) | (0.9%) | (0.9%) | (1.0%) | (1.5%) | (1.3%) | (0.9%) | (1.5%) |
| <50% Low-Wage Employees | 26.2% | 26.3% | 25.9% | 26.7% | 27.1% | 26.5% | 26.7% | 27.5% | 27.4% | 27.2% | 27.5% | 28.4% | 28.6% |
| (Standard Error) | (0.3%) | (0.5%) | (0.4%) | (0.4%) | (0.3%) | (0.3%) | (0.3%) | (0.3%) | (0.4%) | (0.3%) | (0.4%) | (0.4%) | (0.4%) |
| Source: Medical Expenditure Panel Survey-Insurance Component,
private-sector establishments, 2009-2021. Note: Wage levels in the MEPS-IC questionnaires have been adjusted to account for changing wages over time. In 2021, low-wage employees were defined as those earning less than $13.50 per hour. * indicates the estimate is significantly different from the previous year at p < 0.05. ^ indicates that the estimates for employers with 50%+ low wage employees are statistically different from the estimate for employers with <50% low wage employees at p < 0.05. This test is conducted for 2021 only. |
|||||||||||||
Exhibit 4.27 Distributions of employee contribution (in dollars) (standard error) for single, employee-plus-one, and family coverage, overall and by firm size, 2021
| Coverage | Estimate | Total | <50 employees | 50-99 employees | 100 or more employees |
|---|---|---|---|---|---|
| Single | Average (mean) | $1,643 | $1,650 | $1,793 | $1,627 |
| (Standard Error) | ($19) | ($47) | ($89) | ($21) | |
| 10 percentile | $0 | $0* | $0* | $310 | |
| (Standard Error) | ($43) | ($96) | ($75) | ($40) | |
| 25 percentile | $700 | $0* | $530* | $820 | |
| (Standard Error) | ($16) | ($96) | ($132) | ($25) | |
| 50 percentile (median) | $1,400 | $1,200* | $1,500 | $1,400 | |
| (Standard Error) | ($21) | ($67) | ($90) | ($19) | |
| 75 percentile | $2,200 | $2,600* | $2,600* | $2,100 | |
| (Standard Error) | ($28) | ($77) | ($105) | ($30) | |
| 90 percentile | $3,300 | $4,000* | $3,800* | $3,100 | |
| (Standard Error) | ($35) | ($85) | ($206) | ($64) | |
| Employee-plus-one | Average (mean) | $4,199 | $4,984* | $5,526* | $3,986 |
| (Standard Error) | ($64) | ($288) | ($224) | ($62) | |
| 10 percentile | $760 | $0* | $1,500* | $940 | |
| (Standard Error) | ($101) | ($245) | ($232) | ($65) | |
| 25 percentile | $2,100 | $590 †* | $2,800* | $2,200 | |
| (Standard Error) | ($52) | ($318) | ($214) | ($43) | |
| 50 percentile (median) | $3,500 | $4,200* | $4,900* | $3,400 | |
| (Standard Error) | ($43) | ($306) | ($247) | ($41) | |
| 75 percentile | $5,400 | $7,300* | $7,000* | $5,000 | |
| (Standard Error) | ($79) | ($249) | ($286) | ($68) | |
| 90 percentile | $8,200 | $11,000* | $10,000* | $7,500 | |
| (Standard Error) | ($141) | ($650) | ($506) | ($148) | |
| Family | Average (mean) | $6,174 | $6,967* | $7,997* | $5,937 |
| (Standard Error) | ($87) | ($283) | ($384) | ($93) | |
| 10 percentile | $920 | $0* | $890 † | $1,400 | |
| (Standard Error) | ($122) | ($513) | ($501) | ($111) | |
| 25 percentile | $3,000 | $0* | $3,800 | $3,200 | |
| (Standard Error) | ($100) | ($513) | ($409) | ($99) | |
| 50 percentile (median) | $5,100 | $5,500 | $6,600* | $5,100 | |
| (Standard Error) | ($72) | ($371) | ($306) | ($70) | |
| 75 percentile | $7,900 | $11,000* | $11,000* | $7,400 | |
| (Standard Error) | ($124) | ($443) | ($568) | ($120) | |
| 90 percentile | $13,000 | $16,000* | $16,000* | $11,000 | |
| (Standard Error) | ($307) | ($636) | ($933) | ($318) | |
| Source: Medical Expenditure Panel Survey-Insurance Component,
private-sector establishments, 2021. Note: † Estimate does not meet standard of reliability or precision. * indicates that the estimates for firms with <50 and 50-99 employees are statistically different from the estimate for firms with 100+ employees at p < 0.05. |
|||||
Section 5: Employee Cost Sharing
Over the past 12 years, employers have increasingly turned to high-deductible health plans (HDHPs) and other cost-sharing measures to limit growth in health insurance costs and premiums. This section presents trends from 2009 to 2021 in cost-sharing measures overall and by firm size, as well as variation in cost-sharing measures by firm size and State in 2021.
The cost-sharing measures in this section include estimates of the percentages of private-sector employees enrolled in employer-sponsored health insurance (ESI) who face various cost-sharing arrangements, including deductibles, coinsurance rates, copayments, and maximum out-of-pocket payments. The measures also include the percentage enrolled in an HDHP. This section also provides information on average single and family deductibles (overall and among HDHP enrollees), average copayments and coinsurance rates, and average single and family maximum out-of-pocket limits enrolled workers and their families face.
Cost-sharing provisions may vary for different types of healthcare services. The individual and family deductibles reported in this section are general annual deductibles that must be met before many services are covered by the health plan. Coinsurance rates are the percentages of healthcare service expenses paid by the enrollee or family members covered by the plan, and copayments are fixed dollar amounts paid for each healthcare service. Coinsurance rates and copayments are reported separately for office visits to general practitioners and office visits to specialist physicians.
The individual and family maximum out-of-pocket payment limits are the maximum amount a covered individual or family would pay for covered services in a given year. When plans differentiate between in-network and out-of-network providers, the deductibles, coinsurance rates, copayments, and maximum out-of-pocket limits reported in this section are for in-network providers.
HDHPs, as defined in this section, are health insurance plans with deductibles at or above annual thresholds set by the Internal Revenue Service for plans to qualify for Health Savings Accounts. In 2021, the thresholds were $1,400 for single coverage and $2,800 for family coverage.
Highlights
- The percentage of enrollees in a health insurance plan with a deductible in 2021 was not significantly different from 2020 for firms overall (88.5 percent) or for small (86.0), medium (89.7), or large employers (88.8 percent) (Exhibit 5.1).
- From 2020 to 2021, average deductible levels for single coverage overall increased by 3.0 percent, to $2,004, and family coverage deductibles increased by 3.9 percent, to $3,868 (Exhibits 5.2 and 5.3).
- From 2020 to 2021, the percentage of enrollees with a coinsurance payment for physician visits increased overall (from 35.1 to 38.3 percent), among medium firms (from 19.3 to 24.4 percent), and among large firms (from 38.7 to 42.7 percent). The percentage of enrollees with a coinsurance payment for a specialist physician also increased overall (from 36.3 to 38.6 percent) and among large firms (from 40.1 to 43.3 percent) (Exhibits 5.7 and 5.13).
- Overall, the percentage of single-coverage enrollees with an out-of-pocket payment maximum increased from 2012 (80.7 percent) to 2015 (93.9 percent) and declined slightly over the next 4 years. It then increased from 91.0 percent in 2020 to 93.5 percent in 2021, reaching nearly the same level as in 2015 (Exhibit 5.15).
- The overall percentage of family-coverage enrollees with an out-of-pocket payment maximum increased from 2012 (80.9 percent) to 2015 (94.3 percent), fell to 88.7 percent in 2020, then did not change significantly between 2020 and 2021 (89.6 percent) (Exhibit 5.16).
- Among small firms (fewer than 50 employees), the percentage of family-coverage enrollees with an out-of-pocket payment maximum increased by 17.8 percentage points, from 2009 (70.0 percent) to 2015 (87.8 percent). It then fell by 14.0 percentage points to 73.8 percent in 2021 (Exhibit 5.16).
- Based on average annual estimates for 2019-2021, six states (California, District of Columbia, Hawaii, Massachusetts, New Jersey, and New York), had percentages of enrollees in a plan with a deductible, average individual deductibles, and average family deductibles significantly lower than the national average (Exhibits 5.4, 5.5, and 5.6).
- In four of these states (California, District of Columbia, Massachusetts, and New York), the percentage of single and family enrollees in HDHPs and average deductibles among single and family enrollees in HDHPs were also significantly lower than the national average (Exhibits 5.21, 5.22, 5.23, and 5.24).
Key Trends and Differences
A number of longstanding differences in cost-sharing provisions between large employers and both small and medium employers were again evident in 20211. Specifically:
- Small-firm enrollees were less likely than large-firm enrollees to have an annual deductible, but average deductibles among enrollees with a deductible were higher in both small and medium firms than in large firms.
- For office visits to general practitioners and specialists, large-firm enrollees were less likely to have a copayment and more likely to have coinsurance. Among enrollees with these cost-sharing requirements, large-firm enrollees tended to have significantly lower average copayments and coinsurance rates. The one exception is that there was no significant difference between large- and medium-firm enrollees in physician visit coinsurance rates.
- In 2021, large-firm enrollees were more likely than medium- and small-firm enrollees to have maximum out-of-pocket payment limits for both single and family coverage (and thus less likely to face the prospect of unlimited out-of-pocket spending). The difference between large and small firms was evident in all years, but the difference between large and medium firms was insignificant in most years. Among enrollees with limits, large-firm enrollees had lower average maximum out-of-pocket amounts for both individual and family coverage.
- For both single and family coverage, large-firm enrollees were less likely than medium- and small-firm enrollees to be in HDHPs. For small firms, this difference is consistent in nearly every year. For medium firms, the difference is consistent over the last 4 to 5 years.
1 Statistical significance tests for firm-size differences are marked only for 2021.
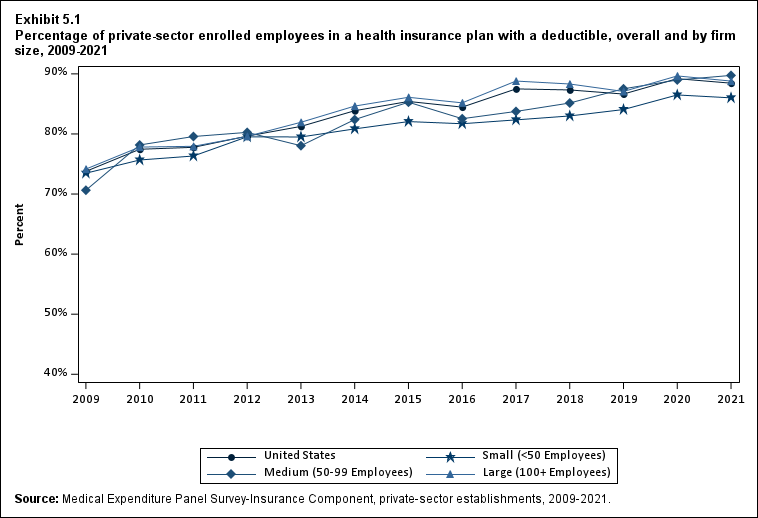
Exhibit 5.1 Percentage (standard error) of private-sector enrolled employees in a health insurance plan with a deductible, overall and by firm size, 2009-2021
| Number of Employees | 2009 | 2010 | 2011 | 2012 | 2013 | 2014 | 2015 | 2016 | 2017 | 2018 | 2019 | 2020 | 2021 |
|---|---|---|---|---|---|---|---|---|---|---|---|---|---|
| U.S. | 73.8% | 77.5%* | 77.8% | 79.6%* | 81.3% | 83.9%* | 85.4%* | 84.5% | 87.5%* | 87.3% | 86.6% | 89.2%* | 88.5% |
| (Standard Error) | (0.5%) | (0.3%) | (0.7%) | (0.6%) | (0.7%) | (0.5%) | (0.5%) | (0.5%) | (0.4%) | (0.4%) | (0.5%) | (0.4%) | (0.5%) |
| <50 | 73.5% | 75.7%* | 76.3% | 79.5%* | 79.5% | 80.8% | 82.1% | 81.7% | 82.3% | 83.0% | 84.1% | 86.5%* | 86.0%^ |
| (Standard Error) | (0.7%) | (0.7%) | (0.4%) | (1.0%) | (0.8%) | (0.8%) | (0.8%) | (0.8%) | (0.8%) | (0.8%) | (0.9%) | (0.8%) | (0.9%) |
| 50-99 | 70.6% | 78.2%* | 79.6% | 80.3% | 78.0% | 82.4%* | 85.3% | 82.5% | 83.7% | 85.1% | 87.5% | 89.0% | 89.7% |
| (Standard Error) | (1.9%) | (1.5%) | (1.7%) | (1.4%) | (1.1%) | (1.5%) | (1.5%) | (1.5%) | (1.6%) | (1.4%) | (1.5%) | (1.5%) | (1.3%) |
| 100+ | 74.2% | 77.8%* | 77.9% | 79.6% | 81.9%* | 84.6%* | 86.1% | 85.2% | 88.8%* | 88.3% | 87.1% | 89.7%* | 88.8% |
| (Standard Error) | (0.6%) | (0.3%) | (1.0%) | (0.7%) | (0.7%) | (0.6%) | (0.6%) | (0.6%) | (0.4%) | (0.5%) | (0.5%) | (0.5%) | (0.5%) |
| Source: Medical Expenditure Panel Survey-Insurance Component,
private-sector establishments, 2009-2021. Note: * indicates the estimate is statistically different from the previous year at p < 0.05. ^ indicates that the estimates for firms with <50 and 50-99 employees are statistically different from the estimate for firms with 100+ employees at p < 0.05. This test is conducted for 2021 only. |
|||||||||||||
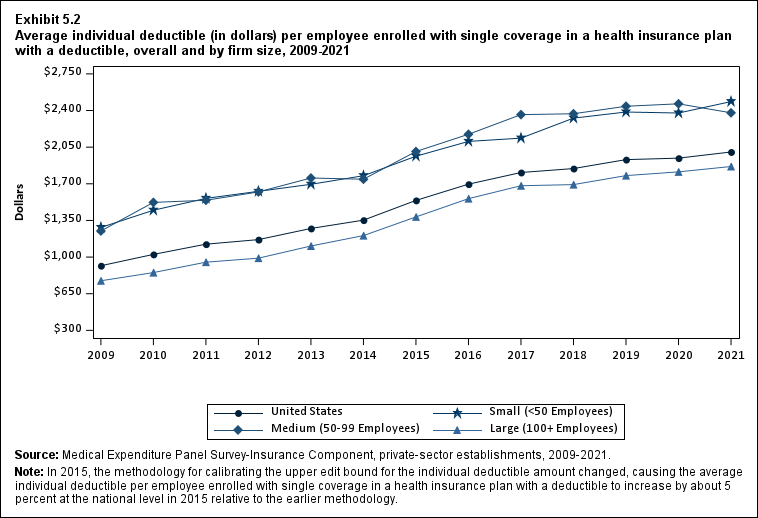
Exhibit 5.2 Average individual deductible (in dollars) (standard error) per employee enrolled with single coverage in a health insurance plan with a deductible, overall and by firm size, 2009-2021
| Number of Employees | 2009 | 2010 | 2011 | 2012 | 2013 | 2014 | 2015 | 2016 | 2017 | 2018 | 2019 | 2020 | 2021 |
|---|---|---|---|---|---|---|---|---|---|---|---|---|---|
| U.S. | $917 | $1,025* | $1,123* | $1,167* | $1,273* | $1,353* | $1,541* | $1,696* | $1,808* | $1,846 | $1,931* | $1,945 | $2,004* |
| (Standard Error) | ($9) | ($18) | ($12) | ($8) | ($20) | ($13) | ($16) | ($16) | ($17) | ($17) | ($18) | ($18) | ($20) |
| <50 | $1,283 | $1,447* | $1,561* | $1,628 | $1,695 | $1,777* | $1,964* | $2,105* | $2,136 | $2,327* | $2,386 | $2,376 | $2,485^ |
| (Standard Error) | ($24) | ($21) | ($26) | ($25) | ($24) | ($28) | ($35) | ($34) | ($35) | ($36) | ($35) | ($39) | ($43) |
| 50-99 | $1,249 | $1,522* | $1,543 | $1,622 | $1,755 | $1,744 | $2,008* | $2,173 | $2,361 | $2,369 | $2,441 | $2,464 | $2,378^ |
| (Standard Error) | ($46) | ($57) | ($49) | ($64) | ($49) | ($59) | ($62) | ($64) | ($85) | ($65) | ($67) | ($67) | ($74) |
| 100+ | $774 | $852* | $951* | $989* | $1,106* | $1,205* | $1,383* | $1,558* | $1,681* | $1,692 | $1,778* | $1,814 | $1,865 |
| (Standard Error) | ($7) | ($20) | ($14) | ($10) | ($19) | ($14) | ($18) | ($18) | ($20) | ($19) | ($21) | ($20) | ($23) |
| Source: Medical Expenditure Panel Survey-Insurance Component,
private-sector establishments, 2009-2021. Note: In 2015, the methodology for calibrating the upper edit bound for the individual deductible amount changed, causing the average individual deductible per employee enrolled with single coverage in a heath insurance plan with a deductible to increase by about 5 percent at the national level in 2015 relative to the earlier methodology. * indicates the estimate is statistically different from the previous year at p < 0.05. ^ indicates that the estimates for firms with <50 and 50-99 employees are statistically different from the estimate for firms with 100+ employees at p < 0.05. This test is conducted for 2021 only. |
|||||||||||||
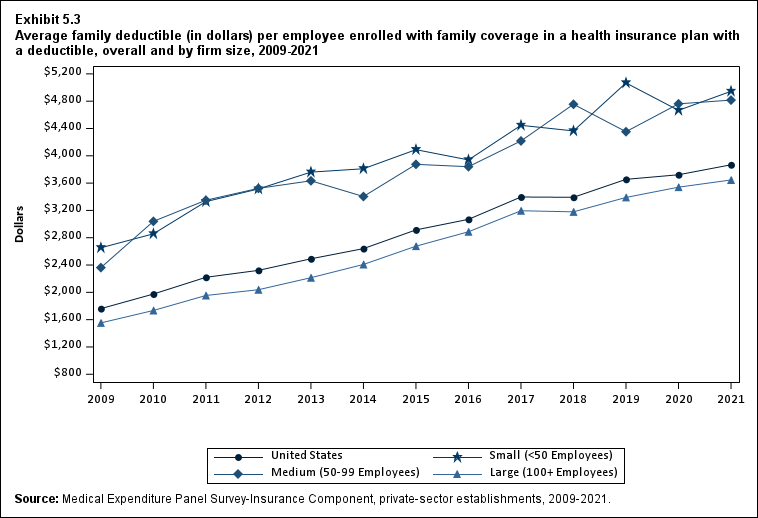
Exhibit 5.3 Average family deductible (in dollars) (standard error) per employee enrolled with family coverage in a health insurance plan with a deductible, overall and by firm size, 2009-2021
| Number of Employees | 2009 | 2010 | 2011 | 2012 | 2013 | 2014 | 2015 | 2016 | 2017 | 2018 | 2019 | 2020 | 2021 |
|---|---|---|---|---|---|---|---|---|---|---|---|---|---|
| U.S. | $1,761 | $1,975* | $2,220* | $2,322* | $2,491* | $2,640* | $2,915* | $3,069* | $3,396* | $3,392 | $3,655* | $3,722 | $3,868* |
| (Standard Error) | ($20) | ($33) | ($31) | ($26) | ($23) | ($28) | ($32) | ($37) | ($48) | ($37) | ($48) | ($52) | ($50) |
| <50 | $2,652 | $2,857* | $3,329* | $3,515* | $3,761* | $3,810 | $4,090* | $3,940 | $4,447* | $4,364 | $5,067* | $4,666* | $4,945^ |
| (Standard Error) | ($50) | ($42) | ($57) | ($71) | ($56) | ($71) | ($88) | ($98) | ($126) | ($97) | ($113) | ($126) | ($157) |
| 50-99 | $2,362 | $3,040* | $3,349 | $3,523 | $3,634 | $3,404 | $3,875* | $3,840 | $4,218 | $4,755 | $4,353 | $4,761 | $4,816^ |
| (Standard Error) | ($113) | ($101) | ($138) | ($113) | ($157) | ($112) | ($148) | ($174) | ($216) | ($172) | ($166) | ($168) | ($170) |
| 100+ | $1,552 | $1,734* | $1,954* | $2,038 | $2,215* | $2,408* | $2,676* | $2,887* | $3,195* | $3,179 | $3,390* | $3,540 | $3,646 |
| (Standard Error) | ($21) | ($33) | ($37) | ($31) | ($18) | ($31) | ($34) | ($41) | ($53) | ($40) | ($53) | ($58) | ($54) |
| Source: Medical Expenditure Panel Survey-Insurance Component,
private-sector establishments, 2009-2021. Note: * indicates the estimate is statistically different from the previous year at p < 0.05. ^ indicates that the estimates for firms with <50 and 50-99 employees are statistically different from the estimate for firms with 100+ employees at p < 0.05. This test is conducted for 2021 only. |
|||||||||||||
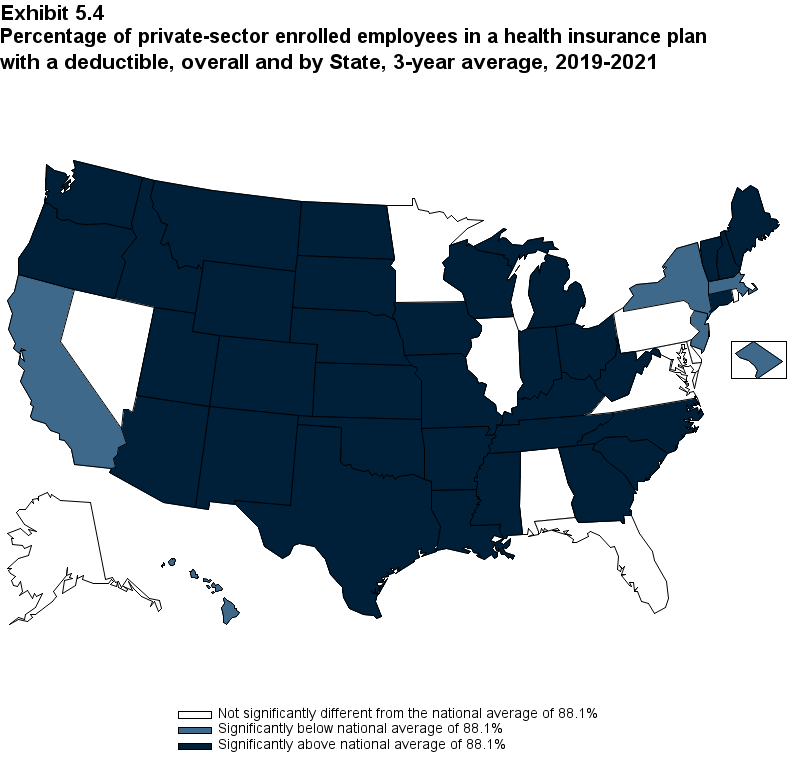
Exhibit 5.4 Percentage (standard error) of private-sector enrolled employees in a health insurance plan with a deductible, overall and by State, 3-year average, 2019-2021
| Alabama | 90.8% | Kentucky | 93.0%* | North Dakota | 95.3%* |
| (Standard Error) | (2.4%) | (Standard Error) | (1.2%) | (Standard Error) | (0.8%) |
| Alaska | 91.8% | Louisiana | 92.0%* | Ohio | 92.5%* |
| (Standard Error) | (2.1%) | (Standard Error) | (1.1%) | (Standard Error) | (1.2%) |
| Arizona | 94.4%* | Maine | 96.3%* | Oklahoma | 95.1%* |
| (Standard Error) | (1.3%) | (Standard Error) | (0.9%) | (Standard Error) | (0.9%) |
| Arkansas | 95.7%* | Maryland | 85.1% | Oregon | 93.8%* |
| (Standard Error) | (0.8%) | (Standard Error) | (2.0%) | (Standard Error) | (1.3%) |
| California | 73.2%* | Massachusetts | 81.6%* | Pennsylvania | 89.1% |
| (Standard Error) | (1.3%) | (Standard Error) | (1.6%) | (Standard Error) | (1.0%) |
| Colorado | 94.4%* | Michigan | 94.1%* | Rhode Island | 88.1% |
| (Standard Error) | (0.9%) | (Standard Error) | (0.9%) | (Standard Error) | (1.3%) |
| Connecticut | 91.6%* | Minnesota | 90.0% | South Carolina | 93.4%* |
| (Standard Error) | (1.2%) | (Standard Error) | (1.9%) | (Standard Error) | (1.5%) |
| Delaware | 90.9% | Mississippi | 96.1%* | South Dakota | 97.1%* |
| (Standard Error) | (1.5%) | (Standard Error) | (0.8%) | (Standard Error) | (0.5%) |
| District of Columbia | 74.6%* | Missouri | 92.5%* | Tennessee | 91.1%* |
| (Standard Error) | (1.6%) | (Standard Error) | (1.0%) | (Standard Error) | (1.2%) |
| Florida | 90.3% | Montana | 96.5%* | Texas | 93.0%* |
| (Standard Error) | (1.4%) | (Standard Error) | (0.7%) | (Standard Error) | (0.7%) |
| Georgia | 91.2%* | Nebraska | 97.5%* | Utah | 93.9%* |
| (Standard Error) | (1.3%) | (Standard Error) | (0.6%) | (Standard Error) | (0.9%) |
| Hawaii | 37.6%* | Nevada | 84.7% | Vermont | 95.0%* |
| (Standard Error) | (1.9%) | (Standard Error) | (1.8%) | (Standard Error) | (0.8%) |
| Idaho | 94.7%* | New Hampshire | 91.2%* | Virginia | 89.7% |
| (Standard Error) | (0.8%) | (Standard Error) | (1.4%) | (Standard Error) | (1.4%) |
| Illinois | 88.7% | New Jersey | 82.4%* | Washington | 93.5%* |
| (Standard Error) | (1.0%) | (Standard Error) | (1.9%) | (Standard Error) | (1.3%) |
| Indiana | 95.2%* | New Mexico | 92.3%* | West Virginia | 94.2%* |
| (Standard Error) | (0.9%) | (Standard Error) | (1.1%) | (Standard Error) | (0.8%) |
| Iowa | 95.0%* | New York | 77.6%* | Wisconsin | 93.2%* |
| (Standard Error) | (0.8%) | (Standard Error) | (1.2%) | (Standard Error) | (1.2%) |
| Kansas | 93.7%* | North Carolina | 94.4%* | Wyoming | 94.4%* |
| (Standard Error) | (1.0%) | (Standard Error) | (0.9%) | (Standard Error) | (1.2%) |
| Source: Medical Expenditure Panel Survey-Insurance Component,
private-sector establishments, 2019-2021. Note: * Statistically different from the national average of 88.1 percent at p < 0.05. Note that the standard error on the national estimate of 88.1 percent is 0.26. |
|||||
|---|---|---|---|---|---|
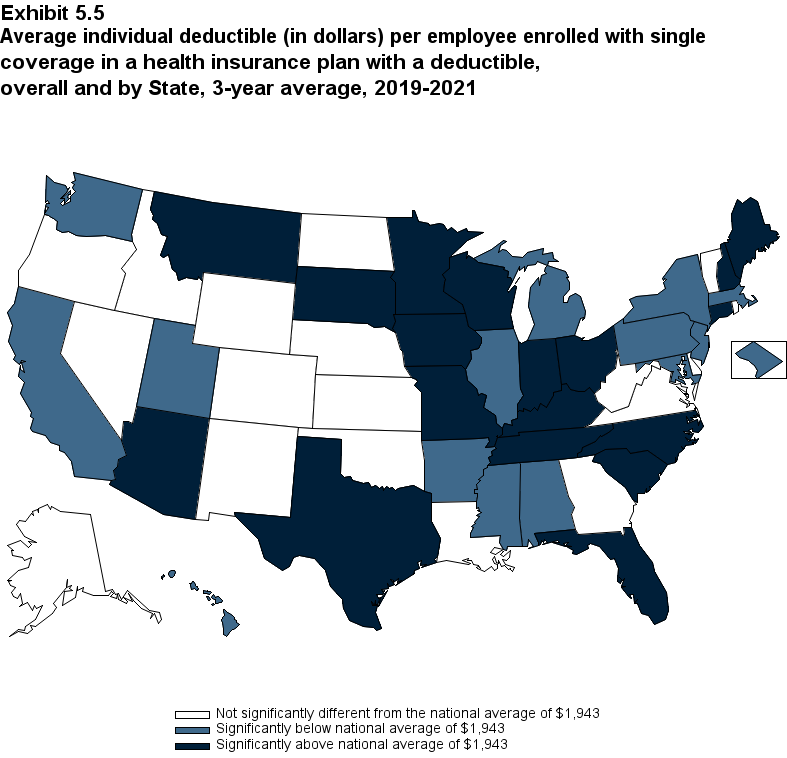
Exhibit 5.5 Average individual deductible (in dollars) (standard error) per employee enrolled with single coverage in a health insurance plan with a deductible, overall and by State, 3-year average, 2019-2021
| Alabama | $1,587* | Kentucky | $2,128* | North Dakota | $1,941 |
| (Standard Error) | ($55) | (Standard Error) | ($53) | (Standard Error) | ($55) |
| Alaska | $1,894 | Louisiana | $1,927 | Ohio | $2,081* |
| (Standard Error) | ($68) | (Standard Error) | ($59) | (Standard Error) | ($49) |
| Arizona | $2,274* | Maine | $2,380* | Oklahoma | $2,039 |
| (Standard Error) | ($66) | (Standard Error) | ($65) | (Standard Error) | ($57) |
| Arkansas | $1,828* | Maryland | $1,658* | Oregon | $2,121 |
| (Standard Error) | ($47) | (Standard Error) | ($57) | (Standard Error) | ($148) |
| California | $1,683* | Massachusetts | $1,693* | Pennsylvania | $1,711* |
| (Standard Error) | ($41) | (Standard Error) | ($65) | (Standard Error) | ($43) |
| Colorado | $2,063 | Michigan | $1,661* | Rhode Island | $1,947 |
| (Standard Error) | ($62) | (Standard Error) | ($46) | (Standard Error) | ($70) |
| Connecticut | $2,130* | Minnesota | $2,230* | South Carolina | $2,097* |
| (Standard Error) | ($61) | (Standard Error) | ($62) | (Standard Error) | ($67) |
| Delaware | $1,828 | Mississippi | $1,728* | South Dakota | $2,407* |
| (Standard Error) | ($61) | (Standard Error) | ($65) | (Standard Error) | ($52) |
| District of Columbia | $1,346* | Missouri | $2,129* | Tennessee | $2,250* |
| (Standard Error) | ($42) | (Standard Error) | ($56) | (Standard Error) | ($66) |
| Florida | $2,087* | Montana | $2,461* | Texas | $2,090* |
| (Standard Error) | ($67) | (Standard Error) | ($70) | (Standard Error) | ($43) |
| Georgia | $1,976 | Nebraska | $2,024 | Utah | $1,819* |
| (Standard Error) | ($60) | (Standard Error) | ($49) | (Standard Error) | ($56) |
| Hawaii | $1,273* | Nevada | $1,839 | Vermont | $2,032 |
| (Standard Error) | ($87) | (Standard Error) | ($63) | (Standard Error) | ($61) |
| Idaho | $2,000 | New Hampshire | $2,429* | Virginia | $1,868 |
| (Standard Error) | ($47) | (Standard Error) | ($71) | (Standard Error) | ($62) |
| Illinois | $1,834* | New Jersey | $1,675* | Washington | $1,807* |
| (Standard Error) | ($42) | (Standard Error) | ($55) | (Standard Error) | ($62) |
| Indiana | $2,165* | New Mexico | $1,971 | West Virginia | $1,950 |
| (Standard Error) | ($56) | (Standard Error) | ($94) | (Standard Error) | ($57) |
| Iowa | $2,155* | New York | $1,739* | Wisconsin | $2,174* |
| (Standard Error) | ($50) | (Standard Error) | ($43) | (Standard Error) | ($61) |
| Kansas | $1,953 | North Carolina | $2,258* | Wyoming | $1,877 |
| (Standard Error) | ($61) | (Standard Error) | ($58) | (Standard Error) | ($53) |
| Source: Medical Expenditure Panel Survey-Insurance Component,
private-sector establishments, 2019-2021. Note: * Statistically different from the national average of $1,943 at p < 0.05. Note that the standard error on the national estimate of $1,943 is $10.47. |
|||||
|---|---|---|---|---|---|
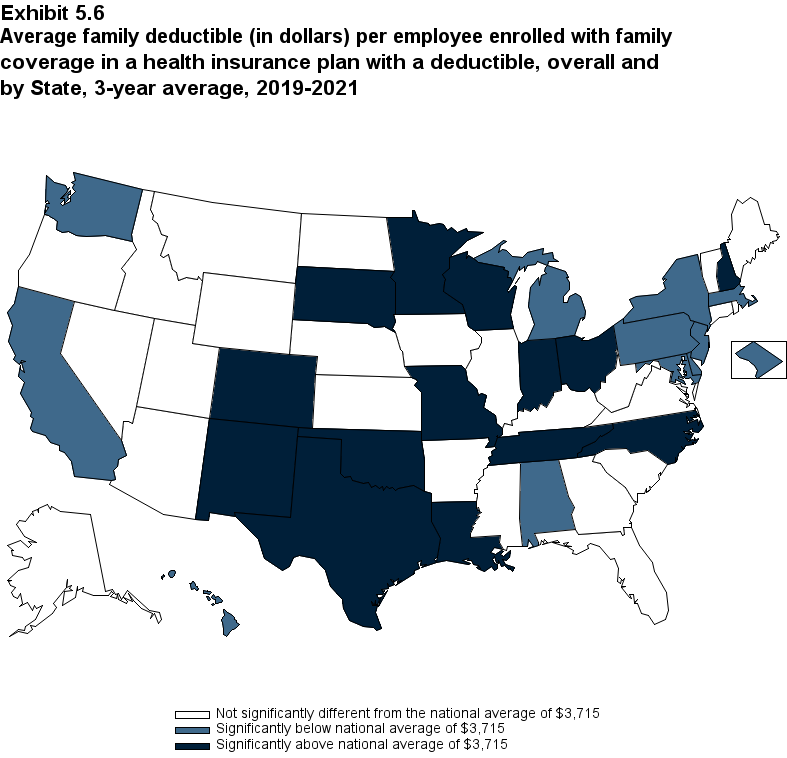
Exhibit 5.6 Average family deductible (in dollars) (standard error) per employee enrolled with family coverage in a health insurance plan with a deductible, overall and by State, 3-year average, 2019-2021
| Alabama | $3,101* | Kentucky | $3,851 | North Dakota | $3,596 |
| (Standard Error) | ($152) | (Standard Error) | ($135) | (Standard Error) | ($121) |
| Alaska | $3,611 | Louisiana | $4,138* | Ohio | $4,011* |
| (Standard Error) | ($175) | (Standard Error) | ($154) | (Standard Error) | ($127) |
| Arizona | $4,433 | Maine | $3,804 | Oklahoma | $4,075* |
| (Standard Error) | ($378) | (Standard Error) | ($183) | (Standard Error) | ($165) |
| Arkansas | $3,550 | Maryland | $3,287* | Oregon | $3,509 |
| (Standard Error) | ($117) | (Standard Error) | ($125) | (Standard Error) | ($161) |
| California | $3,432* | Massachusetts | $3,384* | Pennsylvania | $3,185* |
| (Standard Error) | ($124) | (Standard Error) | ($124) | (Standard Error) | ($105) |
| Colorado | $4,141* | Michigan | $3,044* | Rhode Island | $3,697 |
| (Standard Error) | ($162) | (Standard Error) | ($135) | (Standard Error) | ($195) |
| Connecticut | $3,985 | Minnesota | $4,280* | South Carolina | $3,912 |
| (Standard Error) | ($181) | (Standard Error) | ($153) | (Standard Error) | ($154) |
| Delaware | $3,355* | Mississippi | $3,430 | South Dakota | $4,114* |
| (Standard Error) | ($176) | (Standard Error) | ($148) | (Standard Error) | ($131) |
| District of Columbia | $2,867* | Missouri | $4,142* | Tennessee | $4,284* |
| (Standard Error) | ($125) | (Standard Error) | ($128) | (Standard Error) | ($216) |
| Florida | $3,825 | Montana | $3,630 | Texas | $4,023* |
| (Standard Error) | ($188) | (Standard Error) | ($169) | (Standard Error) | ($114) |
| Georgia | $4,062 | Nebraska | $3,829 | Utah | $3,854 |
| (Standard Error) | ($192) | (Standard Error) | ($123) | (Standard Error) | ($127) |
| Hawaii | $2,795* | Nevada | $3,476 | Vermont | $3,700 |
| (Standard Error) | ($171) | (Standard Error) | ($144) | (Standard Error) | ($144) |
| Idaho | $3,486 | New Hampshire | $4,428* | Virginia | $3,600 |
| (Standard Error) | ($130) | (Standard Error) | ($166) | (Standard Error) | ($153) |
| Illinois | $3,709 | New Jersey | $3,309* | Washington | $3,365* |
| (Standard Error) | ($119) | (Standard Error) | ($157) | (Standard Error) | ($149) |
| Indiana | $4,086* | New Mexico | $4,040* | West Virginia | $3,749 |
| (Standard Error) | ($153) | (Standard Error) | ($145) | (Standard Error) | ($163) |
| Iowa | $3,943 | New York | $3,216* | Wisconsin | $4,122* |
| (Standard Error) | ($122) | (Standard Error) | ($83) | (Standard Error) | ($143) |
| Kansas | $3,627 | North Carolina | $4,033* | Wyoming | $3,897 |
| (Standard Error) | ($131) | (Standard Error) | ($144) | (Standard Error) | ($150) |
| Source: Medical Expenditure Panel Survey-Insurance Component,
private-sector establishments, 2019-2021. Note: * Statistically different from the national average of $3,715 at p < 0.05. Note that the standard error on the national estimate of $3,715 is $28.24. |
|||||
|---|---|---|---|---|---|
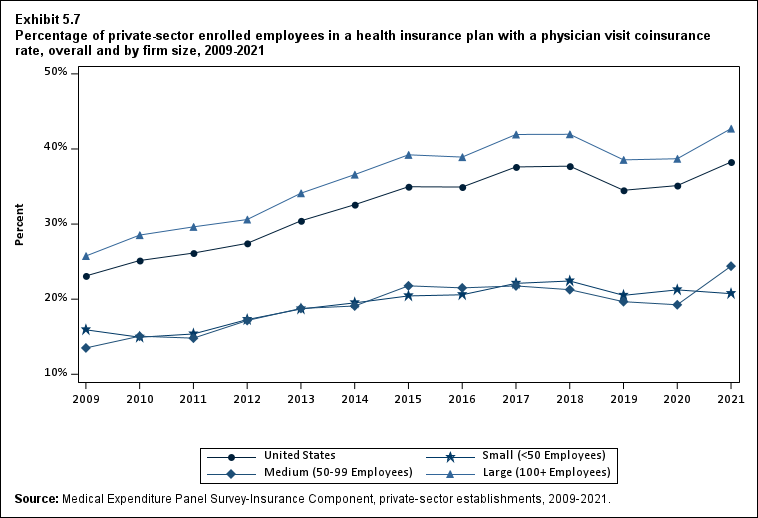
Exhibit 5.7 Percentage (standard error) of private-sector enrolled employees in a health insurance plan with a physician visit coinsurance rate, overall and by firm size, 2009-2021
| Number of Employees | 2009 | 2010 | 2011 | 2012 | 2013 | 2014 | 2015 | 2016 | 2017 | 2018 | 2019 | 2020 | 2021 |
|---|---|---|---|---|---|---|---|---|---|---|---|---|---|
| U.S. | 23.1% | 25.1%* | 26.1% | 27.4%* | 30.4%* | 32.6%* | 35.0%* | 34.9% | 37.6%* | 37.7% | 34.5%* | 35.1% | 38.3%* |
| (Standard Error) | (0.7%) | (0.7%) | (0.4%) | (0.4%) | (0.3%) | (0.6%) | (0.6%) | (0.6%) | (0.7%) | (0.6%) | (0.7%) | (0.6%) | (0.7%) |
| <50 | 15.9% | 14.9% | 15.4% | 17.3%* | 18.7% | 19.5% | 20.4% | 20.6% | 22.1% | 22.4% | 20.5% | 21.2% | 20.7%^ |
| (Standard Error) | (0.5%) | (0.4%) | (0.5%) | (0.5%) | (1.0%) | (0.7%) | (0.9%) | (0.8%) | (0.8%) | (0.8%) | (0.9%) | (0.9%) | (1.0%) |
| 50-99 | 13.5% | 15.1% | 14.8% | 17.2% | 18.8% | 19.1% | 21.8% | 21.5% | 21.8% | 21.3% | 19.7% | 19.3% | 24.4%*^ |
| (Standard Error) | (1.7%) | (1.4%) | (1.6%) | (1.2%) | (1.0%) | (1.5%) | (1.7%) | (1.6%) | (1.6%) | (1.6%) | (1.6%) | (1.5%) | (1.9%) |
| 100+ | 25.7% | 28.5%* | 29.6% | 30.6% | 34.1%* | 36.6%* | 39.2%* | 38.9% | 41.9%* | 42.0% | 38.5%* | 38.7% | 42.7%* |
| (Standard Error) | (0.9%) | (0.9%) | (0.5%) | (0.5%) | (0.5%) | (0.8%) | (0.8%) | (0.7%) | (0.9%) | (0.8%) | (0.9%) | (0.7%) | (0.8%) |
| Source: Medical Expenditure Panel Survey-Insurance Component,
private-sector establishments, 2009-2021. Note: * indicates the estimate is statistically different from the previous year at p < 0.05. ^ indicates that the estimates for firms with <50 and 50-99 employees are statistically different from the estimate for firms with 100+ employees at p < 0.05. This test is conducted for 2021 only. |
|||||||||||||
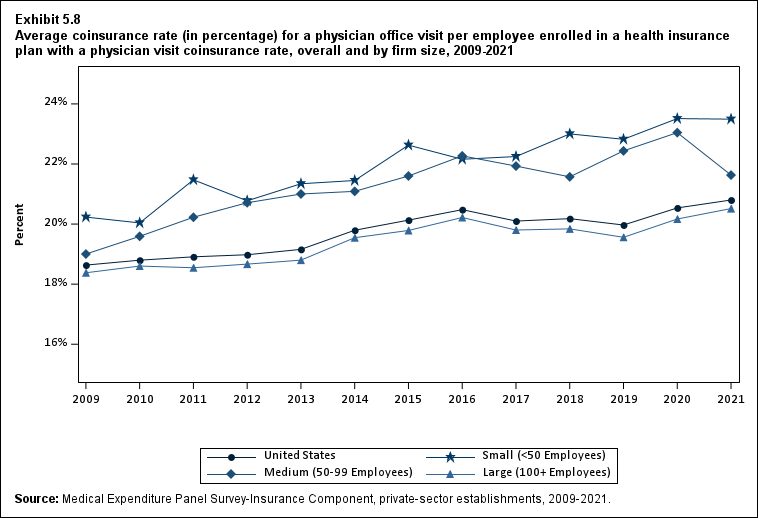
Exhibit 5.8 Average coinsurance rate (in percentage) (standard error) for a physician office visit per employee enrolled in a health insurance plan with a physician visit coinsurance rate, overall and by firm size, 2009-2021
| Number of Employees | 2009 | 2010 | 2011 | 2012 | 2013 | 2014 | 2015 | 2016 | 2017 | 2018 | 2019 | 2020 | 2021 |
|---|---|---|---|---|---|---|---|---|---|---|---|---|---|
| U.S. | 18.6% | 18.8% | 18.9% | 19.0% | 19.2% | 19.8%* | 20.1% | 20.5% | 20.1% | 20.2% | 20.0% | 20.5%* | 20.8% |
| (Standard Error) | (0.1%) | (0.2%) | (0.2%) | (0.2%) | (0.1%) | (0.1%) | (0.1%) | (0.1%) | (0.2%) | (0.2%) | (0.1%) | (0.2%) | (0.2%) |
| <50 | 20.2% | 20.0% | 21.5%* | 20.8% | 21.3% | 21.5% | 22.6%* | 22.2% | 22.2% | 23.0% | 22.8% | 23.5% | 23.5%^ |
| (Standard Error) | (0.3%) | (0.2%) | (0.3%) | (0.2%) | (0.4%) | (0.3%) | (0.4%) | (0.4%) | (0.4%) | (0.4%) | (0.4%) | (0.6%) | (0.5%) |
| 50-99 | 19.0% | 19.6% | 20.2% | 20.7% | 21.0% | 21.1% | 21.6% | 22.3% | 21.9% | 21.6% | 22.4% | 23.0% | 21.6% |
| (Standard Error) | (0.6%) | (0.8%) | (0.8%) | (0.4%) | (0.7%) | (0.7%) | (0.7%) | (0.7%) | (0.7%) | (0.7%) | (0.7%) | (0.8%) | (0.7%) |
| 100+ | 18.4% | 18.6% | 18.5% | 18.7% | 18.8% | 19.5%* | 19.8% | 20.2% | 19.8% | 19.8% | 19.6% | 20.2%* | 20.5% |
| (Standard Error) | (0.2%) | (0.2%) | (0.2%) | (0.2%) | (0.1%) | (0.2%) | (0.2%) | (0.2%) | (0.2%) | (0.2%) | (0.2%) | (0.2%) | (0.2%) |
| Source: Medical Expenditure Panel Survey-Insurance Component,
private-sector establishments, 2009-2021. Note: * indicates the estimate is statistically different from the previous year at p < 0.05. ^ indicates that the estimates for firms with <50 and 50-99 employees are statistically different from the estimate for firms with 100+ employees at p < 0.05. This test is conducted for 2021 only. |
|||||||||||||
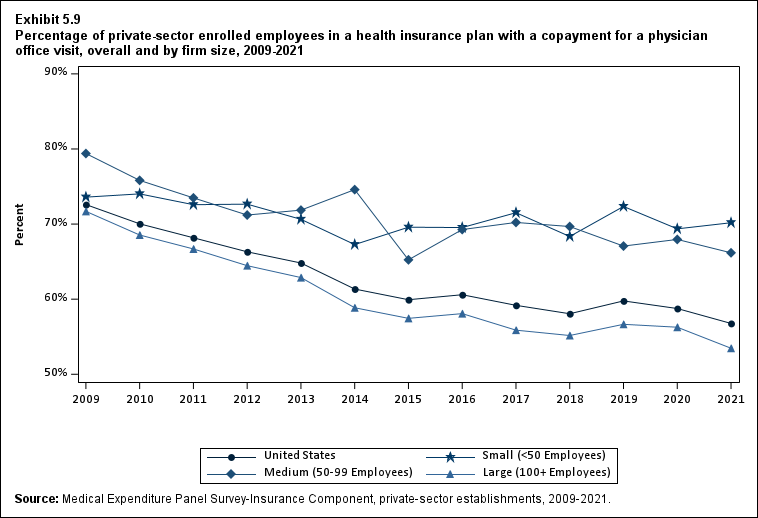
Exhibit 5.9 Percentage (standard error) of private-sector enrolled employees in a health insurance plan with a copayment for a physician office visit, overall and by firm size, 2009-2021
| Number of Employees | 2009 | 2010 | 2011 | 2012 | 2013 | 2014 | 2015 | 2016 | 2017 | 2018 | 2019 | 2020 | 2021 |
|---|---|---|---|---|---|---|---|---|---|---|---|---|---|
| U.S. | 72.6% | 70.0%* | 68.2% | 66.3% | 64.8% | 61.3%* | 59.9% | 60.6% | 59.2% | 58.1% | 59.8% | 58.8% | 56.8%* |
| (Standard Error) | (0.5%) | (0.7%) | (0.7%) | (0.7%) | (0.5%) | (0.6%) | (0.6%) | (0.6%) | (0.7%) | (0.6%) | (0.7%) | (0.6%) | (0.7%) |
| <50 | 73.6% | 74.0% | 72.6% | 72.7% | 70.6% | 67.3%* | 69.6% | 69.5% | 71.5% | 68.3%* | 72.3%* | 69.4%* | 70.2%^ |
| (Standard Error) | (0.5%) | (0.4%) | (0.7%) | (1.0%) | (0.7%) | (0.9%) | (1.0%) | (0.9%) | (0.9%) | (0.9%) | (1.0%) | (1.0%) | (1.1%) |
| 50-99 | 79.4% | 75.8% | 73.5% | 71.2% | 71.9% | 74.6% | 65.2%* | 69.3% | 70.2% | 69.7% | 67.1% | 68.0% | 66.2%^ |
| (Standard Error) | (1.8%) | (1.6%) | (1.1%) | (1.7%) | (1.5%) | (1.6%) | (2.0%) | (1.8%) | (1.8%) | (1.8%) | (2.0%) | (2.0%) | (2.1%) |
| 100+ | 71.7% | 68.5%* | 66.7% | 64.5% | 62.9% | 58.9%* | 57.4% | 58.1% | 55.9% | 55.2% | 56.7% | 56.3% | 53.5%* |
| (Standard Error) | (0.5%) | (0.9%) | (0.9%) | (0.9%) | (0.6%) | (0.8%) | (0.8%) | (0.8%) | (0.9%) | (0.8%) | (0.9%) | (0.8%) | (0.8%) |
| Source: Medical Expenditure Panel Survey-Insurance Component,
private-sector establishments, 2009-2021. Note: * indicates the estimate is statistically different from the previous year at p < 0.05. ^ indicates that the estimates for firms with <50 and 50-99 employees are statistically different from the estimate for firms with 100+ employees at p < 0.05. This test is conducted for 2021 only. |
|||||||||||||
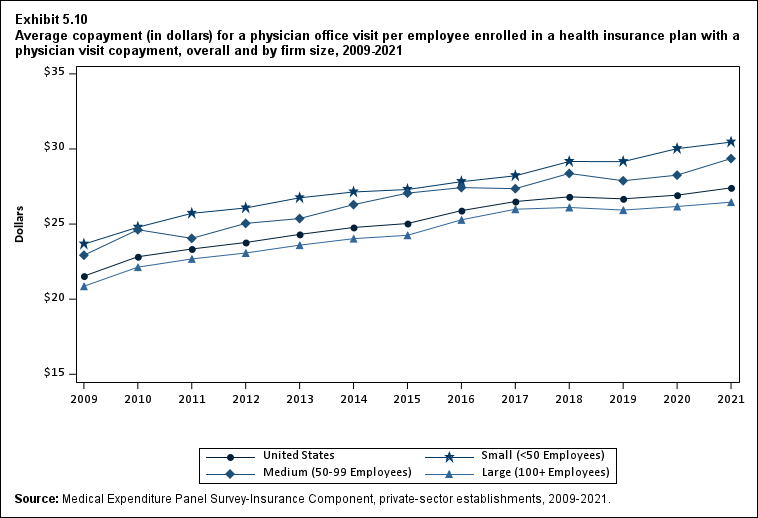
Exhibit 5.10 Average copayment (in dollars) (standard error) for a physician office visit per employee enrolled in a health insurance plan with a physician visit copayment, overall and by firm size, 2009-2021
| Number of Employees | 2009 | 2010 | 2011 | 2012 | 2013 | 2014 | 2015 | 2016 | 2017 | 2018 | 2019 | 2020 | 2021 |
|---|---|---|---|---|---|---|---|---|---|---|---|---|---|
| U.S. | $21.53 | $22.82* | $23.34* | $23.77* | $24.31* | $24.77* | $25.04 | $25.89* | $26.50* | $26.81 | $26.68 | $26.92 | $27.41* |
| (Standard Error) | ($0.10) | ($0.10) | ($0.11) | ($0.16) | ($0.13) | ($0.12) | ($0.12) | ($0.12) | ($0.13) | ($0.14) | ($0.16) | ($0.17) | ($0.18) |
| <50 | $23.66 | $24.79* | $25.71* | $26.07 | $26.75* | $27.14 | $27.30 | $27.82 | $28.21 | $29.16* | $29.16 | $30.02 | $30.46^ |
| (Standard Error) | ($0.07) | ($0.15) | ($0.17) | ($0.14) | ($0.22) | ($0.22) | ($0.22) | ($0.23) | ($0.27) | ($0.25) | ($0.30) | ($0.34) | ($0.44) |
| 50-99 | $22.93 | $24.62* | $24.05 | $25.05* | $25.37 | $26.29 | $27.06 | $27.43 | $27.36 | $28.37 | $27.88 | $28.26 | $29.36^ |
| (Standard Error) | ($0.31) | ($0.36) | ($0.34) | ($0.26) | ($0.44) | ($0.35) | ($0.40) | ($0.39) | ($0.48) | ($0.42) | ($0.48) | ($0.53) | ($0.64) |
| 100+ | $20.86 | $22.13* | $22.68* | $23.07 | $23.60 | $24.03* | $24.25 | $25.28* | $25.99* | $26.11 | $25.93 | $26.17 | $26.46 |
| (Standard Error) | ($0.12) | ($0.11) | ($0.12) | ($0.22) | ($0.17) | ($0.14) | ($0.15) | ($0.15) | ($0.16) | ($0.16) | ($0.20) | ($0.20) | ($0.19) |
| Source: Medical Expenditure Panel Survey-Insurance Component,
private-sector establishments, 2009-2021. Note: * indicates the estimate is statistically different from the previous year at p < 0.05. ^ indicates that the estimates for firms with <50 and 50-99 employees are statistically different from the estimate for firms with 100+ employees at p < 0.05. This test is conducted for 2021 only. |
|||||||||||||
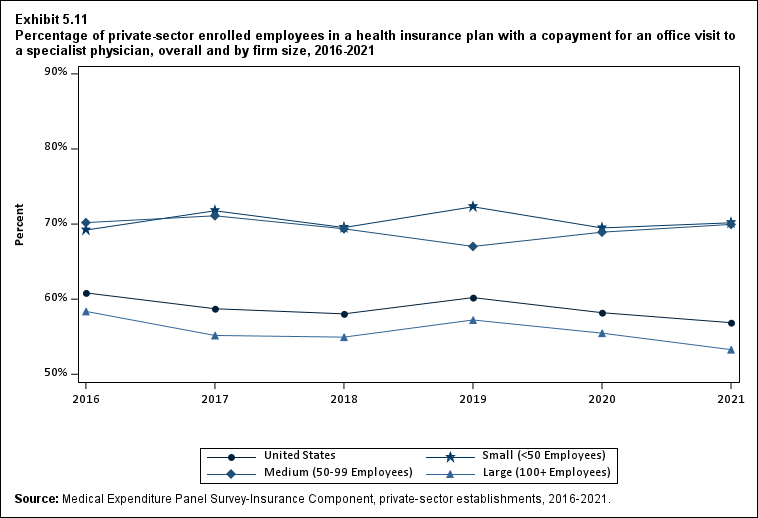
Exhibit 5.11 Percentage (standard error) of private-sector enrolled employees in a health insurance plan with a copayment for an office visit to a specialist physician, overall and by firm size, 2016-2021
| Number of Employees | 2016 | 2017 | 2018 | 2019 | 2020 | 2021 |
|---|---|---|---|---|---|---|
| U.S. | 60.8% | 58.7%* | 58.0% | 60.2%* | 58.2%* | 56.9% |
| (Standard Error) | (0.6%) | (0.7%) | (0.6%) | (0.7%) | (0.7%) | (0.7%) |
| <50 | 69.2% | 71.8%* | 69.5% | 72.3%* | 69.5%* | 70.2%^ |
| (Standard Error) | (0.9%) | (0.9%) | (0.9%) | (1.0%) | (1.0%) | (1.1%) |
| 50-99 | 70.2% | 71.1% | 69.4% | 67.0% | 68.9% | 70.0%^ |
| (Standard Error) | (1.8%) | (1.8%) | (1.8%) | (1.9%) | (1.9%) | (2.0%) |
| 100+ | 58.4% | 55.2%* | 54.9% | 57.2% | 55.5% | 53.3% |
| (Standard Error) | (0.7%) | (0.8%) | (0.8%) | (0.9%) | (0.8%) | (0.8%) |
| Source: Medical Expenditure Panel Survey-Insurance Component,
private-sector establishments, 2016-2021. Note: * indicates the estimate is statistically different from the previous year at p < 0.05. ^ indicates that the estimates for firms with <50 and 50-99 employees are statistically different from the estimate for firms with 100+ employees at p < 0.05. This test is conducted for 2021 only. |
||||||
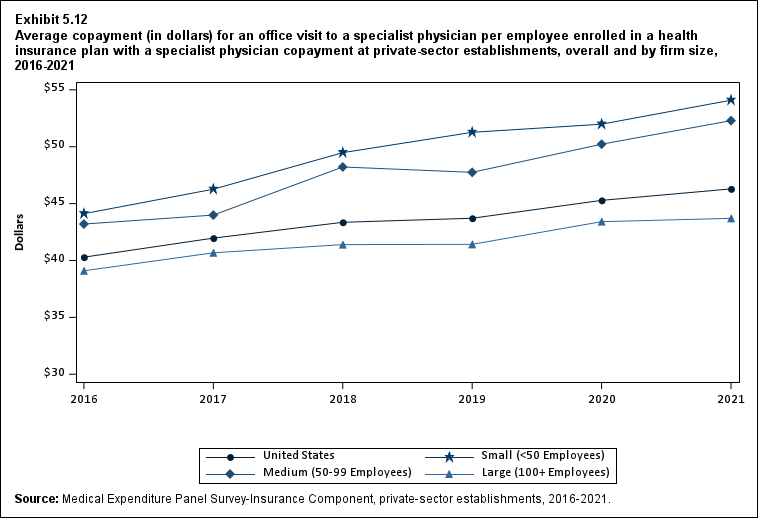
Exhibit 5.12 Average copayment (in dollars) (standard error) for an office visit to a specialist physician per employee enrolled in a health insurance plan with a specialist physician copayment at private-sector establishments, overall and by firm size, 2016-2021
| Number of Employees | 2016 | 2017 | 2018 | 2019 | 2020 | 2021 |
|---|---|---|---|---|---|---|
| U.S. | $40.29 | $41.97* | $43.36* | $43.71 | $45.29* | $46.29 |
| (Standard Error) | ($0.23) | ($0.26) | ($0.28) | ($0.31) | ($0.41) | ($0.35) |
| <50 | $44.11 | $46.27* | $49.48* | $51.27* | $51.98 | $54.09^ |
| (Standard Error) | ($0.42) | ($0.44) | ($0.47) | ($0.61) | ($0.69) | ($0.84) |
| 50-99 | $43.20 | $43.99 | $48.22* | $47.75 | $50.22 | $52.29^ |
| (Standard Error) | ($0.87) | ($0.82) | ($0.88) | ($0.97) | ($1.05) | ($1.10) |
| 100+ | $39.10 | $40.68* | $41.40 | $41.42 | $43.41* | $43.71 |
| (Standard Error) | ($0.28) | ($0.32) | ($0.34) | ($0.36) | ($0.51) | ($0.38) |
| Source: Medical Expenditure Panel Survey-Insurance Component,
private-sector establishments, 2016-2021. Note: * indicates the estimate is statistically different from the previous year at p < 0.05. ^ indicates that the estimates for firms with <50 and 50-99 employees are statistically different from the estimate for firms with 100+ employees at p < 0.05. This test is conducted for 2021 only. |
||||||
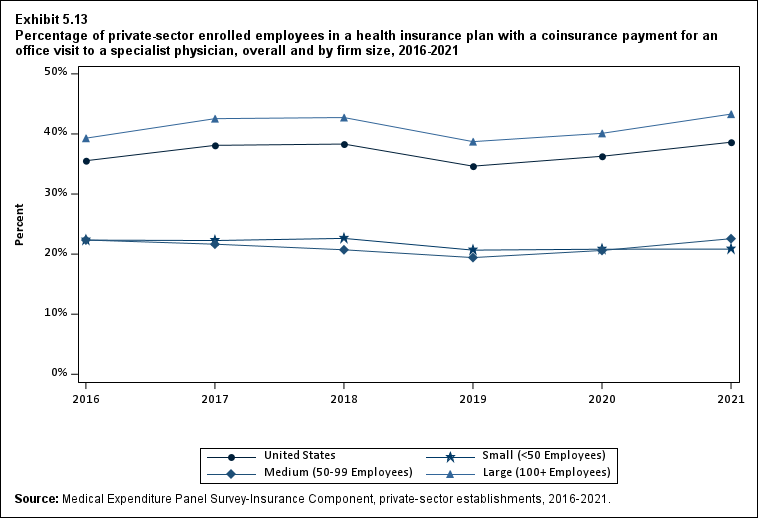
Exhibit 5.13 Percentage (standard error) of private-sector enrolled employees in a health insurance plan with a coinsurance payment for an office visit to a specialist physician, overall and by firm size, 2016-2021
| Number of Employees | 2016 | 2017 | 2018 | 2019 | 2020 | 2021 |
|---|---|---|---|---|---|---|
| U.S. | 35.5% | 38.1%* | 38.3% | 34.6%* | 36.3% | 38.6%* |
| (Standard Error) | (0.6%) | (0.7%) | (0.6%) | (0.8%) | (0.7%) | (0.7%) |
| <50 | 22.3% | 22.3% | 22.6% | 20.7% | 20.8% | 20.8%^ |
| (Standard Error) | (0.8%) | (0.8%) | (0.8%) | (0.9%) | (0.9%) | (1.0%) |
| 50-99 | 22.3% | 21.7% | 20.7% | 19.4% | 20.6% | 22.6%^ |
| (Standard Error) | (1.6%) | (1.6%) | (1.5%) | (1.6%) | (1.6%) | (1.8%) |
| 100+ | 39.3% | 42.5%* | 42.7% | 38.7%* | 40.1% | 43.3%* |
| (Standard Error) | (0.7%) | (0.8%) | (0.8%) | (0.9%) | (0.8%) | (0.8%) |
| Source: Medical Expenditure Panel Survey-Insurance Component,
private-sector establishments, 2016-2021. Note: * indicates the estimate is statistically different from the previous year at p < 0.05. ^ indicates that the estimates for firms with <50 and 50-99 employees are statistically different from the estimate for firms with 100+ employees at p < 0.05. This test is conducted for 2021 only. |
||||||
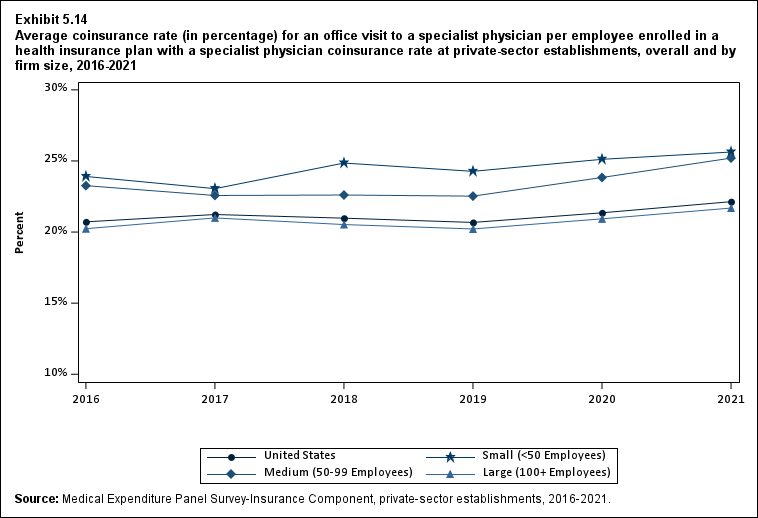
Exhibit 5.14 Average coinsurance rate (in percentage) (standard error) for an office visit to a specialist physician per employee enrolled in a health insurance plan with a specialist physician coinsurance rate at private-sector establishments, overall and by firm size, 2016-2021
| Number of Employees | 2016 | 2017 | 2018 | 2019 | 2020 | 2021 |
|---|---|---|---|---|---|---|
| U.S. | 20.7% | 21.2%* | 21.0% | 20.7% | 21.4%* | 22.1%* |
| (Standard Error) | (0.2%) | (0.2%) | (0.2%) | (0.2%) | (0.2%) | (0.2%) |
| <50 | 23.9% | 23.1% | 24.9%* | 24.3% | 25.1% | 25.6%^ |
| (Standard Error) | (0.4%) | (0.4%) | (0.5%) | (0.5%) | (0.6%) | (0.7%) |
| 50-99 | 23.3% | 22.6% | 22.6% | 22.5% | 23.8% | 25.2%^ |
| (Standard Error) | (0.8%) | (0.7%) | (0.8%) | (0.7%) | (0.9%) | (0.9%) |
| 100+ | 20.2% | 21.0%* | 20.5% | 20.2% | 20.9%* | 21.7%* |
| (Standard Error) | (0.2%) | (0.2%) | (0.2%) | (0.2%) | (0.2%) | (0.2%) |
| Source: Medical Expenditure Panel Survey-Insurance Component,
private-sector establishments, 2016-2021. Note: * indicates the estimate is statistically different from the previous year at p < 0.05. ^ indicates that the estimates for firms with <50 and 50-99 employees are statistically different from the estimate for firms with 100+ employees at p < 0.05. This test is conducted for 2021 only. |
||||||
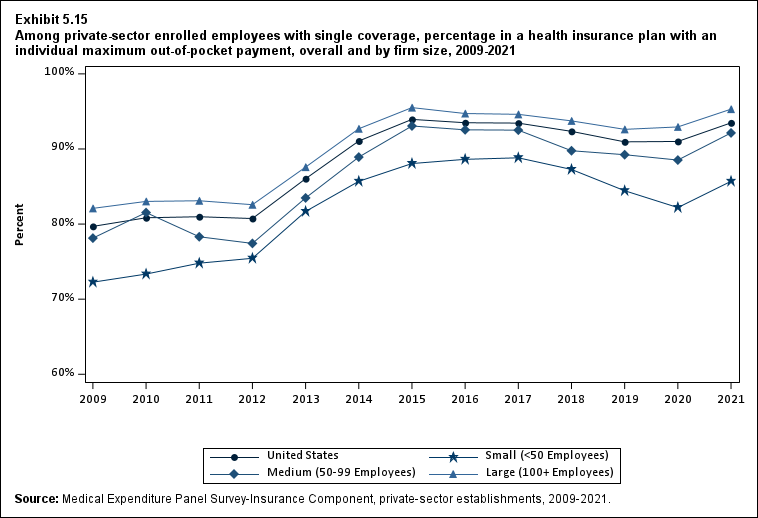
Exhibit 5.15 Among private-sector enrolled employees with single coverage, percentage (standard error) in a health insurance plan with an individual maximum out-of-pocket payment, overall and by firm size, 2009-2021
| Number of Employees | 2009 | 2010 | 2011 | 2012 | 2013 | 2014 | 2015 | 2016 | 2017 | 2018 | 2019 | 2020 | 2021 |
|---|---|---|---|---|---|---|---|---|---|---|---|---|---|
| U.S. | 79.7% | 80.8% | 81.0% | 80.7% | 86.0%* | 91.1%* | 93.9%* | 93.5% | 93.4% | 92.3%* | 90.9%* | 91.0% | 93.5%* |
| (Standard Error) | (0.6%) | (0.5%) | (0.5%) | (0.3%) | (0.5%) | (0.4%) | (0.3%) | (0.4%) | (0.3%) | (0.3%) | (0.4%) | (0.4%) | (0.3%) |
| <50 | 72.3% | 73.3% | 74.8% | 75.4% | 81.7%* | 85.7%* | 88.1%* | 88.6% | 88.8% | 87.3% | 84.4%* | 82.2% | 85.7%*^ |
| (Standard Error) | (0.8%) | (0.7%) | (1.1%) | (0.4%) | (0.7%) | (0.8%) | (0.7%) | (0.7%) | (0.7%) | (0.7%) | (1.0%) | (1.0%) | (0.9%) |
| 50-99 | 78.1% | 81.5% | 78.3% | 77.4% | 83.5%* | 88.9%* | 93.1%* | 92.5% | 92.5% | 89.8% | 89.2% | 88.5% | 92.1%*^ |
| (Standard Error) | (1.6%) | (2.5%) | (1.8%) | (2.6%) | (0.8%) | (1.3%) | (1.2%) | (1.4%) | (1.2%) | (1.4%) | (1.5%) | (1.3%) | (1.2%) |
| 100+ | 82.1% | 83.0% | 83.1% | 82.6% | 87.6%* | 92.7%* | 95.5%* | 94.7% | 94.6% | 93.7% | 92.6% | 92.9% | 95.3%* |
| (Standard Error) | (0.8%) | (0.7%) | (0.6%) | (0.5%) | (0.6%) | (0.4%) | (0.3%) | (0.5%) | (0.4%) | (0.4%) | (0.4%) | (0.4%) | (0.3%) |
| Source: Medical Expenditure Panel Survey-Insurance Component,
private-sector establishments, 2009-2021. Note: * indicates the estimate is statistically different from the previous year at p < 0.05. ^ indicates that the estimates for firms with <50 and 50-99 employees are statistically different from the estimate for firms with 100+ employees at p < 0.05. This test is conducted for 2021 only. |
|||||||||||||
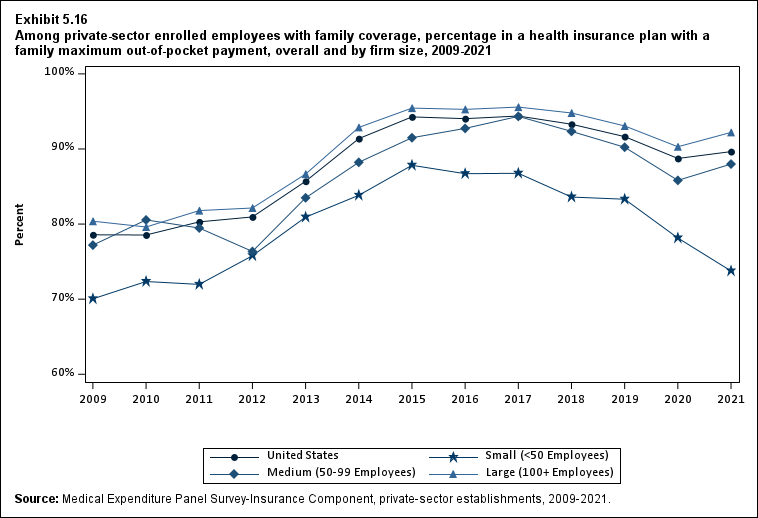
Exhibit 5.16 Among private-sector enrolled employees with family coverage, percentage (standard error) in a health insurance plan with a family maximum out-of-pocket payment, overall and by firm size, 2009-2021
| Number of Employees | 2009 | 2010 | 2011 | 2012 | 2013 | 2014 | 2015 | 2016 | 2017 | 2018 | 2019 | 2020 | 2021 |
|---|---|---|---|---|---|---|---|---|---|---|---|---|---|
| U.S. | 78.6% | 78.5% | 80.3% | 80.9% | 85.7%* | 91.4%* | 94.3%* | 94.0% | 94.4% | 93.3% | 91.6%* | 88.7%* | 89.6% |
| (Standard Error) | (0.9%) | (0.8%) | (0.5%) | (0.5%) | (0.9%) | (0.5%) | (0.4%) | (0.4%) | (0.4%) | (0.4%) | (0.5%) | (0.5%) | (0.5%) |
| <50 | 70.0% | 72.3% | 72.0% | 75.8%* | 80.9%* | 83.8% | 87.8%* | 86.7% | 86.8% | 83.6% | 83.3% | 78.1%* | 73.8%^ |
| (Standard Error) | (1.3%) | (0.8%) | (0.6%) | (1.4%) | (1.2%) | (1.3%) | (1.1%) | (1.1%) | (1.0%) | (1.3%) | (1.3%) | (1.7%) | (2.1%) |
| 50-99 | 77.2% | 80.6% | 79.5% | 76.4% | 83.5%* | 88.2% | 91.5% | 92.7% | 94.3% | 92.3% | 90.2% | 85.8% | 88.0%^ |
| (Standard Error) | (2.5%) | (2.0%) | (1.6%) | (2.7%) | (1.9%) | (1.8%) | (1.5%) | (1.4%) | (1.2%) | (1.6%) | (1.7%) | (2.3%) | (2.0%) |
| 100+ | 80.4% | 79.6% | 81.8% | 82.1% | 86.7%* | 92.9%* | 95.4%* | 95.3% | 95.6% | 94.8% | 93.1%* | 90.3%* | 92.2%* |
| (Standard Error) | (0.9%) | (0.9%) | (0.7%) | (0.8%) | (1.0%) | (0.5%) | (0.5%) | (0.4%) | (0.4%) | (0.5%) | (0.5%) | (0.5%) | (0.5%) |
| Source: Medical Expenditure Panel Survey-Insurance Component,
private-sector establishments, 2009-2021. Note: * indicates the estimate is statistically different from the previous year at p < 0.05. ^ indicates that the estimates for firms with <50 and 50-99 employees are statistically different from the estimate for firms with 100+ employees at p < 0.05. This test is conducted for 2021 only. |
|||||||||||||
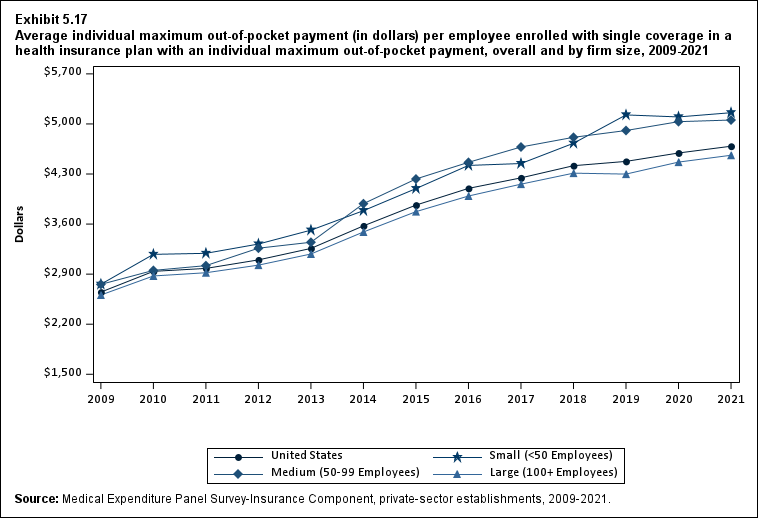
Exhibit 5.17 Average individual maximum out-of-pocket payment (in dollars) (standard error) per employee enrolled with single coverage in a health insurance plan with an individual maximum out-of-pocket payment, overall and by firm size, 2009-2021
| Number of Employees | 2009 | 2010 | 2011 | 2012 | 2013 | 2014 | 2015 | 2016 | 2017 | 2018 | 2019 | 2020 | 2021 |
|---|---|---|---|---|---|---|---|---|---|---|---|---|---|
| U.S. | $2,649 | $2,939* | $2,980 | $3,099* | $3,259* | $3,575* | $3,865* | $4,099* | $4,246* | $4,416* | $4,476 | $4,594* | $4,688* |
| (Standard Error) | ($29) | ($46) | ($18) | ($25) | ($17) | ($30) | ($24) | ($24) | ($21) | ($25) | ($28) | ($25) | ($26) |
| <50 | $2,758 | $3,177* | $3,191 | $3,321* | $3,515* | $3,787* | $4,096* | $4,420* | $4,446 | $4,730* | $5,126* | $5,098 | $5,157^ |
| (Standard Error) | ($26) | ($125) | ($43) | ($48) | ($38) | ($49) | ($52) | ($53) | ($47) | ($45) | ($54) | ($58) | ($66) |
| 50-99 | $2,757 | $2,952* | $3,019 | $3,263 | $3,346 | $3,885* | $4,230* | $4,463 | $4,678 | $4,813 | $4,908 | $5,032 | $5,055^ |
| (Standard Error) | ($47) | ($84) | ($92) | ($99) | ($71) | ($100) | ($96) | ($81) | ($87) | ($80) | ($76) | ($103) | ($99) |
| 100+ | $2,608 | $2,874* | $2,920 | $3,026* | $3,182* | $3,489* | $3,774* | $3,992* | $4,158* | $4,312* | $4,299 | $4,467* | $4,562* |
| (Standard Error) | ($39) | ($68) | ($31) | ($29) | ($21) | ($37) | ($28) | ($28) | ($25) | ($30) | ($34) | ($29) | ($30) |
| Source: Medical Expenditure Panel Survey-Insurance Component,
private-sector establishments, 2009-2021. Note: * indicates the estimate is statistically different from the previous year at p < 0.05. ^ indicates that the estimates for firms with <50 and 50-99 employees are statistically different from the estimate for firms with 100+ employees at p < 0.05. This test is conducted for 2021 only. |
|||||||||||||
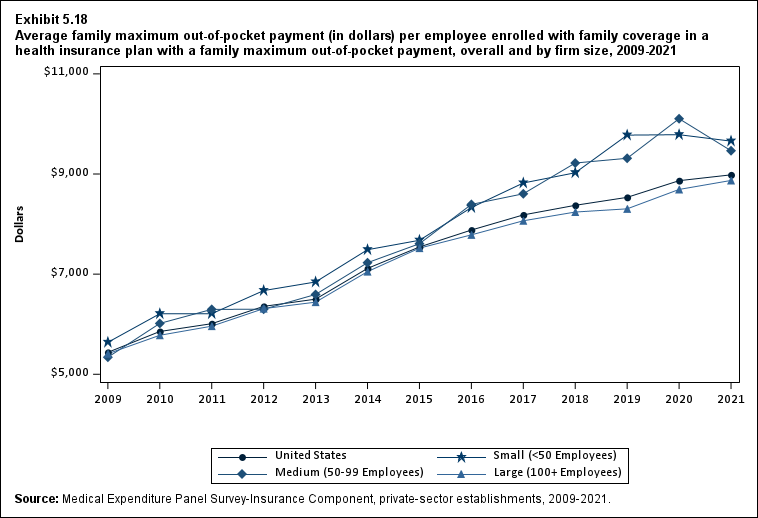
Exhibit 5.18 Average family maximum out-of-pocket payment (in dollars) (standard error) per employee enrolled with family coverage in a health insurance plan with a family maximum out-of-pocket payment, overall and by firm size, 2009-2021
| Number of Employees | 2009 | 2010 | 2011 | 2012 | 2013 | 2014 | 2015 | 2016 | 2017 | 2018 | 2019 | 2020 | 2021 |
|---|---|---|---|---|---|---|---|---|---|---|---|---|---|
| U.S. | $5,438 | $5,854* | $6,010 | $6,356* | $6,500* | $7,114* | $7,542* | $7,881* | $8,183* | $8,375* | $8,534 | $8,867* | $8,983 |
| (Standard Error) | ($67) | ($78) | ($54) | ($61) | ($40) | ($63) | ($60) | ($67) | ($65) | ($63) | ($65) | ($69) | ($70) |
| <50 | $5,638 | $6,209* | $6,210 | $6,671* | $6,843 | $7,488* | $7,676 | $8,330* | $8,821* | $9,025 | $9,777* | $9,785 | $9,657^ |
| (Standard Error) | ($67) | ($129) | ($102) | ($155) | ($140) | ($123) | ($135) | ($155) | ($136) | ($143) | ($157) | ($177) | ($185) |
| 50-99 | $5,340 | $6,015* | $6,296 | $6,299 | $6,594 | $7,228 | $7,608 | $8,393* | $8,605 | $9,219 | $9,314 | $10,104* | $9,465^ |
| (Standard Error) | ($159) | ($178) | ($234) | ($277) | ($281) | ($301) | ($239) | ($265) | ($246) | ($231) | ($217) | ($228) | ($254) |
| 100+ | $5,410 | $5,779* | $5,961 | $6,311* | $6,440 | $7,050* | $7,519* | $7,785* | $8,066* | $8,240 | $8,304 | $8,692* | $8,871 |
| (Standard Error) | ($73) | ($97) | ($64) | ($65) | ($53) | ($72) | ($68) | ($76) | ($74) | ($72) | ($73) | ($76) | ($78) |
| Source: Medical Expenditure Panel Survey-Insurance Component,
private-sector establishments, 2009-2021. Note: * indicates the estimate is statistically different from the previous year at p < 0.05. ^ indicates that the estimates for firms with <50 and 50-99 employees are statistically different from the estimate for firms with 100+ employees at p < 0.05. This test is conducted for 2021 only. |
|||||||||||||
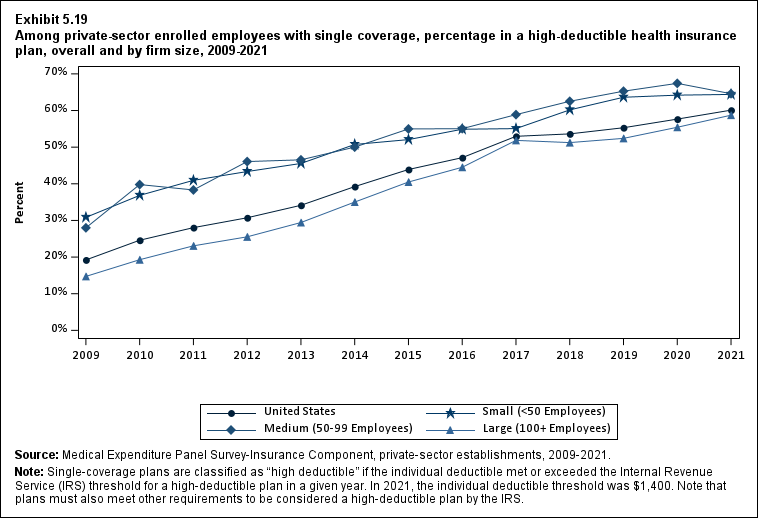
Exhibit 5.19 Among private-sector enrolled employees with single coverage, percentage (standard error) in a high-deductible health insurance plan, overall and by firm size, 2009-2021
| Number of Employees | 2009 | 2010 | 2011 | 2012 | 2013 | 2014 | 2015 | 2016 | 2017 | 2018 | 2019 | 2020 | 2021 |
|---|---|---|---|---|---|---|---|---|---|---|---|---|---|
| U.S. | 19.2% | 24.6%* | 28.0%* | 30.7%* | 34.1%* | 39.2%* | 43.9%* | 47.1%* | 53.0%* | 53.6% | 55.3% | 57.7%* | 60.1%* |
| (Standard Error) | (0.6%) | (0.7%) | (0.4%) | (0.4%) | (0.6%) | (0.6%) | (0.6%) | (0.6%) | (0.6%) | (0.6%) | (0.7%) | (0.7%) | (0.7%) |
| <50 | 30.8% | 36.8%* | 40.9%* | 43.3% | 45.6% | 50.7%* | 52.1% | 54.9% | 55.1% | 60.2%* | 63.6%* | 64.2% | 64.4%^ |
| (Standard Error) | (1.0%) | (0.8%) | (0.7%) | (1.1%) | (1.2%) | (1.1%) | (1.1%) | (1.1%) | (1.1%) | (1.0%) | (1.2%) | (1.2%) | (1.3%) |
| 50-99 | 28.0% | 39.8%* | 38.3% | 46.1%* | 46.5% | 50.0% | 55.0% | 55.0% | 58.9% | 62.5% | 65.3% | 67.4% | 64.6%^ |
| (Standard Error) | (1.8%) | (2.2%) | (1.9%) | (1.9%) | (2.1%) | (2.1%) | (2.3%) | (2.0%) | (2.0%) | (2.0%) | (2.1%) | (2.1%) | (2.3%) |
| 100+ | 14.7% | 19.3%* | 23.1%* | 25.5%* | 29.4%* | 35.0%* | 40.5%* | 44.5%* | 51.8%* | 51.2% | 52.4% | 55.4%* | 58.7%* |
| (Standard Error) | (0.5%) | (0.6%) | (0.4%) | (0.5%) | (0.6%) | (0.8%) | (0.8%) | (0.8%) | (0.8%) | (0.8%) | (0.9%) | (0.8%) | (0.8%) |
| Source: Medical Expenditure Panel Survey-Insurance Component,
private-sector establishments, 2009-2021. Note: Single coverage plans are classified as "high deductible" if the individual deductible met or exceeded the Internal Revenue Service (IRS) threshold for a high-deductible plan in a given year. In 2021, the individual deductible threshold was $1,400. Note that plans must also meet other requirements to be considered a high-deductible plan by the IRS. * indicates the estimate is statistically different from the previous year at p < 0.05. ^ indicates that the estimates for firms with <50 and 50-99 employees are statistically different from the estimate for firms with 100+ employees at p < 0.05. This test is conducted for 2021 only. |
|||||||||||||
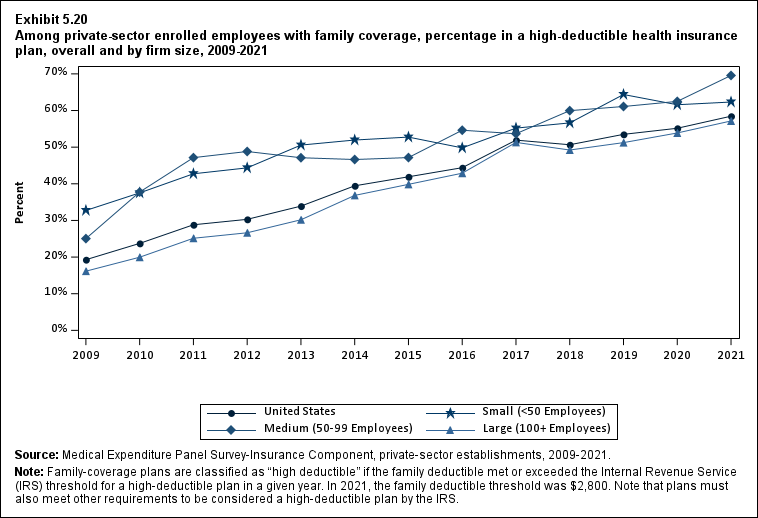
Exhibit 5.20 Among private-sector enrolled employees with family coverage, percentage (standard error) in a high-deductible health insurance plan, overall and by firm size, 2009-2021
| Number of Employees | 2009 | 2010 | 2011 | 2012 | 2013 | 2014 | 2015 | 2016 | 2017 | 2018 | 2019 | 2020 | 2021 |
|---|---|---|---|---|---|---|---|---|---|---|---|---|---|
| U.S. | 19.3% | 23.7%* | 28.8%* | 30.3%* | 33.9%* | 39.4%* | 41.9%* | 44.4%* | 51.9%* | 50.7% | 53.5%* | 55.2% | 58.4%* |
| (Standard Error) | (0.6%) | (0.7%) | (0.5%) | (0.4%) | (0.4%) | (0.8%) | (0.8%) | (0.8%) | (0.9%) | (0.8%) | (0.9%) | (0.9%) | (0.9%) |
| <50 | 32.7% | 37.5%* | 42.7%* | 44.3% | 50.6%* | 51.9% | 52.7% | 49.8% | 55.2%* | 56.6% | 64.4%* | 61.6% | 62.3%^ |
| (Standard Error) | (1.0%) | (1.1%) | (1.7%) | (1.6%) | (1.0%) | (1.5%) | (1.6%) | (1.6%) | (1.7%) | (1.6%) | (1.7%) | (1.9%) | (2.0%) |
| 50-99 | 25.0% | 37.7%* | 47.1%* | 48.8% | 47.1% | 46.6% | 47.2% | 54.6% | 53.7% | 60.0% | 61.1% | 62.5% | 69.6%^ |
| (Standard Error) | (1.7%) | (2.4%) | (2.1%) | (2.6%) | (3.0%) | (2.6%) | (2.8%) | (3.1%) | (3.1%) | (2.9%) | (2.7%) | (4.1%) | (2.6%) |
| 100+ | 16.2% | 20.0%* | 25.1%* | 26.6% | 30.2%* | 36.8%* | 39.8%* | 42.9%* | 51.3%* | 49.2% | 51.2% | 53.9% | 57.1%* |
| (Standard Error) | (0.8%) | (0.7%) | (0.6%) | (0.5%) | (0.5%) | (0.9%) | (0.9%) | (1.0%) | (1.1%) | (0.9%) | (1.1%) | (1.0%) | (1.0%) |
| Source: Medical Expenditure Panel Survey-Insurance Component,
private-sector establishments, 2009-2021. Note: Family coverage plans are classified as "high deductible" if the family deductible met or exceeded the Internal Revenue Service (IRS) threshold for a high-deductible plan in a given year. In 2021, the family deductible threshold was $2,800. Note that plans must also meet other requirements to be considered a high-deductible plan by the IRS. * indicates the estimate is statistically different from the previous year at p < 0.05. ^ indicates that the estimates for firms with <50 and 50-99 employees are statistically different from the estimate for firms with 100+ employees at p < 0.05. This test is conducted for 2021 only. |
|||||||||||||
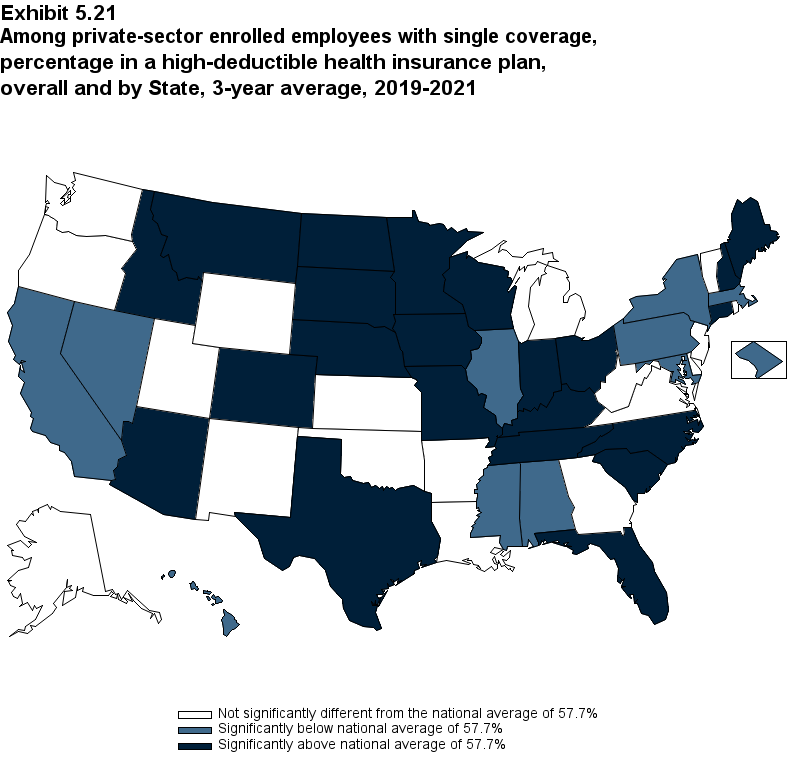
Exhibit 5.21 Among private-sector enrolled employees with single coverage, percentage in a high-deductible health insurance plan, overall and by State, 3-year average, 2019-2021
| Alabama | 44.6%* | Kentucky | 70.7%* | North Dakota | 61.5%* |
| (Standard Error) | (2.5%) | (Standard Error) | (1.9%) | (Standard Error) | (1.9%) |
| Alaska | 54.9% | Louisiana | 55.6% | Ohio | 65.1%* |
| (Standard Error) | (2.4%) | (Standard Error) | (2.2%) | (Standard Error) | (2.0%) |
| Arizona | 70.6%* | Maine | 72.0%* | Oklahoma | 61.6% |
| (Standard Error) | (2.4%) | (Standard Error) | (1.9%) | (Standard Error) | (2.2%) |
| Arkansas | 60.0% | Maryland | 52.3%* | Oregon | 62.0% |
| (Standard Error) | (2.3%) | (Standard Error) | (2.4%) | (Standard Error) | (2.9%) |
| California | 45.1%* | Massachusetts | 51.6%* | Pennsylvania | 53.1%* |
| (Standard Error) | (1.6%) | (Standard Error) | (2.3%) | (Standard Error) | (1.7%) |
| Colorado | 65.9%* | Michigan | 56.9% | Rhode Island | 58.0% |
| (Standard Error) | (2.4%) | (Standard Error) | (2.2%) | (Standard Error) | (2.2%) |
| Connecticut | 65.1%* | Minnesota | 67.0%* | South Carolina | 64.7%* |
| (Standard Error) | (2.2%) | (Standard Error) | (2.4%) | (Standard Error) | (2.4%) |
| Delaware | 55.2% | Mississippi | 49.2%* | South Dakota | 76.7%* |
| (Standard Error) | (2.4%) | (Standard Error) | (2.4%) | (Standard Error) | (1.9%) |
| District of Columbia | 32.3%* | Missouri | 65.2%* | Tennessee | 65.0%* |
| (Standard Error) | (1.8%) | (Standard Error) | (2.1%) | (Standard Error) | (2.1%) |
| Florida | 62.9%* | Montana | 70.5%* | Texas | 61.1%* |
| (Standard Error) | (2.2%) | (Standard Error) | (2.0%) | (Standard Error) | (1.5%) |
| Georgia | 60.2% | Nebraska | 65.7%* | Utah | 62.2% |
| (Standard Error) | (2.7%) | (Standard Error) | (2.4%) | (Standard Error) | (2.3%) |
| Hawaii | 15.7%* | Nevada | 49.2%* | Vermont | 61.1% |
| (Standard Error) | (1.4%) | (Standard Error) | (2.4%) | (Standard Error) | (2.0%) |
| Idaho | 66.9%* | New Hampshire | 70.0%* | Virginia | 53.8% |
| (Standard Error) | (2.0%) | (Standard Error) | (2.3%) | (Standard Error) | (2.5%) |
| Illinois | 54.0%* | New Jersey | 53.2% | Washington | 59.8% |
| (Standard Error) | (1.6%) | (Standard Error) | (2.7%) | (Standard Error) | (2.4%) |
| Indiana | 67.2%* | New Mexico | 54.7% | West Virginia | 58.6% |
| (Standard Error) | (2.0%) | (Standard Error) | (2.4%) | (Standard Error) | (2.3%) |
| Iowa | 68.6%* | New York | 47.1%* | Wisconsin | 65.9%* |
| (Standard Error) | (1.8%) | (Standard Error) | (1.5%) | (Standard Error) | (2.0%) |
| Kansas | 60.0% | North Carolina | 72.3%* | Wyoming | 60.1% |
| (Standard Error) | (2.2%) | (Standard Error) | (1.9%) | (Standard Error) | (2.6%) |
| Source: Medical Expenditure Panel Survey-Insurance Component,
private-sector establishments, 2019-2021. Note: * Statistically different from the national average of 57.7 percent at p < 0.05. Note that the standard error on the national estimate of 57.7 percent is 0.39. |
|||||
|---|---|---|---|---|---|
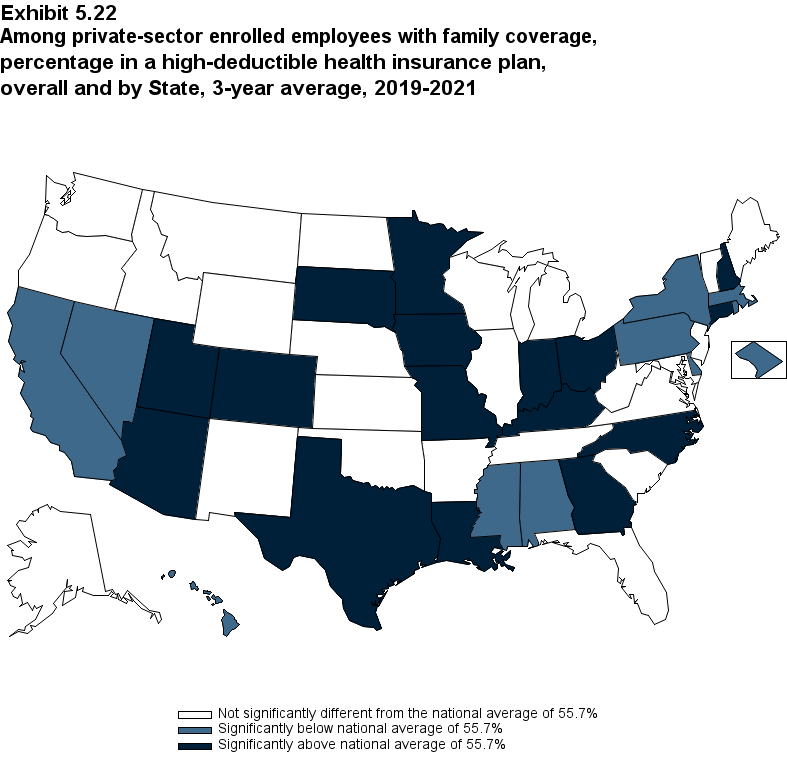
Exhibit 5.22 Among private-sector enrolled employees with family coverage, percentage in a high-deductible health insurance plan, overall and by State, 3-year average, 2019-2021
| Alabama | 42.5%* | Kentucky | 65.0%* | North Dakota | 54.3% |
| (Standard Error) | (3.2%) | (Standard Error) | (3.4%) | (Standard Error) | (2.6%) |
| Alaska | 51.1% | Louisiana | 65.3%* | Ohio | 64.1%* |
| (Standard Error) | (3.7%) | (Standard Error) | (2.7%) | (Standard Error) | (2.7%) |
| Arizona | 68.9%* | Maine | 60.4% | Oklahoma | 61.0% |
| (Standard Error) | (3.9%) | (Standard Error) | (3.6%) | (Standard Error) | (2.7%) |
| Arkansas | 58.0% | Maryland | 51.2% | Oregon | 55.9% |
| (Standard Error) | (2.8%) | (Standard Error) | (2.8%) | (Standard Error) | (3.0%) |
| California | 45.7%* | Massachusetts | 48.3%* | Pennsylvania | 48.2%* |
| (Standard Error) | (1.9%) | (Standard Error) | (2.5%) | (Standard Error) | (2.3%) |
| Colorado | 66.2%* | Michigan | 55.3% | Rhode Island | 48.1%* |
| (Standard Error) | (3.0%) | (Standard Error) | (3.2%) | (Standard Error) | (2.7%) |
| Connecticut | 62.4%* | Minnesota | 62.8%* | South Carolina | 58.6% |
| (Standard Error) | (3.0%) | (Standard Error) | (2.8%) | (Standard Error) | (3.3%) |
| Delaware | 47.2%* | Mississippi | 49.7%* | South Dakota | 64.8%* |
| (Standard Error) | (3.4%) | (Standard Error) | (2.9%) | (Standard Error) | (2.7%) |
| District of Columbia | 35.7%* | Missouri | 64.3%* | Tennessee | 60.9% |
| (Standard Error) | (2.4%) | (Standard Error) | (2.5%) | (Standard Error) | (3.4%) |
| Florida | 58.3% | Montana | 55.9% | Texas | 60.3%* |
| (Standard Error) | (2.7%) | (Standard Error) | (3.4%) | (Standard Error) | (2.0%) |
| Georgia | 62.2%* | Nebraska | 61.1% | Utah | 65.6%* |
| (Standard Error) | (2.7%) | (Standard Error) | (2.9%) | (Standard Error) | (2.3%) |
| Hawaii | 18.0%* | Nevada | 48.2%* | Vermont | 57.8% |
| (Standard Error) | (1.7%) | (Standard Error) | (2.6%) | (Standard Error) | (2.9%) |
| Idaho | 51.5% | New Hampshire | 63.8%* | Virginia | 51.1% |
| (Standard Error) | (2.5%) | (Standard Error) | (2.8%) | (Standard Error) | (3.1%) |
| Illinois | 55.9% | New Jersey | 51.3% | Washington | 59.5% |
| (Standard Error) | (2.1%) | (Standard Error) | (4.0%) | (Standard Error) | (3.6%) |
| Indiana | 65.1%* | New Mexico | 59.6% | West Virginia | 57.6% |
| (Standard Error) | (3.0%) | (Standard Error) | (2.4%) | (Standard Error) | (2.8%) |
| Iowa | 61.0%* | New York | 44.8%* | Wisconsin | 59.9% |
| (Standard Error) | (2.6%) | (Standard Error) | (1.8%) | (Standard Error) | (2.5%) |
| Kansas | 53.9% | North Carolina | 66.1%* | Wyoming | 60.8% |
| (Standard Error) | (2.5%) | (Standard Error) | (3.1%) | (Standard Error) | (3.2%) |
| Source: Medical Expenditure Panel Survey-Insurance Component,
private-sector establishments, 2019-2021. Note: * Statistically different from the national average of 55.7 percent at p < 0.05. Note that the standard error on the national estimate of 55.7 percent is 0.50. |
|||||
|---|---|---|---|---|---|
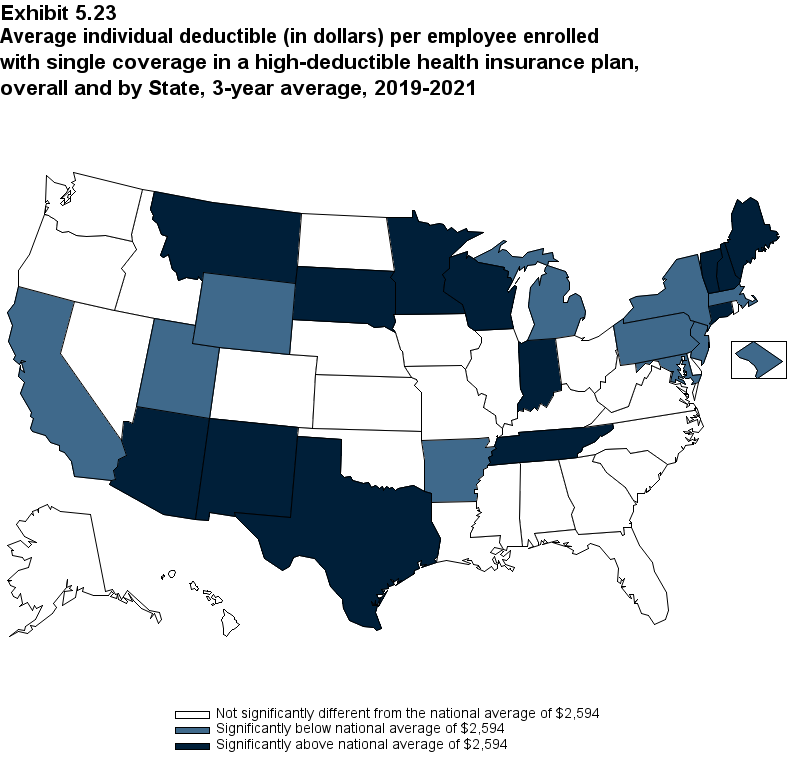
Exhibit 5.23 Average individual deductible (in dollars) per employee enrolled with single coverage in a high-deductible health insurance plan, overall and by State, 3-year average, 2019-2021
| Alabama | $2,614 | Kentucky | $2,579 | North Dakota | $2,621 |
| (Standard Error) | ($72) | (Standard Error) | ($65) | (Standard Error) | ($57) |
| Alaska | $2,684 | Louisiana | $2,686 | Ohio | $2,640 |
| (Standard Error) | ($80) | (Standard Error) | ($63) | (Standard Error) | ($54) |
| Arizona | $2,797* | Maine | $2,972* | Oklahoma | $2,707 |
| (Standard Error) | ($63) | (Standard Error) | ($60) | (Standard Error) | ($67) |
| Arkansas | $2,456* | Maryland | $2,297* | Oregon | $2,863 |
| (Standard Error) | ($55) | (Standard Error) | ($56) | (Standard Error) | ($154) |
| California | $2,338* | Massachusetts | $2,300* | Pennsylvania | $2,417* |
| (Standard Error) | ($42) | (Standard Error) | ($64) | (Standard Error) | ($45) |
| Colorado | $2,605 | Michigan | $2,287* | Rhode Island | $2,623 |
| (Standard Error) | ($57) | (Standard Error) | ($45) | (Standard Error) | ($60) |
| Connecticut | $2,731* | Minnesota | $2,782* | South Carolina | $2,708 |
| (Standard Error) | ($54) | (Standard Error) | ($54) | (Standard Error) | ($63) |
| Delaware | $2,600 | Mississippi | $2,687 | South Dakota | $2,825* |
| (Standard Error) | ($68) | (Standard Error) | ($79) | (Standard Error) | ($43) |
| District of Columbia | $2,318* | Missouri | $2,696 | Tennessee | $2,843* |
| (Standard Error) | ($52) | (Standard Error) | ($60) | (Standard Error) | ($65) |
| Florida | $2,695 | Montana | $3,086* | Texas | $2,778* |
| (Standard Error) | ($67) | (Standard Error) | ($72) | (Standard Error) | ($40) |
| Georgia | $2,601 | Nebraska | $2,587 | Utah | $2,358* |
| (Standard Error) | ($59) | (Standard Error) | ($67) | (Standard Error) | ($50) |
| Hawaii | $2,444 | Nevada | $2,632 | Vermont | $2,799* |
| (Standard Error) | ($100) | (Standard Error) | ($70) | (Standard Error) | ($57) |
| Idaho | $2,556 | New Hampshire | $2,947* | Virginia | $2,626 |
| (Standard Error) | ($48) | (Standard Error) | ($73) | (Standard Error) | ($67) |
| Illinois | $2,551 | New Jersey | $2,221* | Washington | $2,482 |
| (Standard Error) | ($45) | (Standard Error) | ($42) | (Standard Error) | ($69) |
| Indiana | $2,741* | New Mexico | $2,820* | West Virginia | $2,695 |
| (Standard Error) | ($55) | (Standard Error) | ($111) | (Standard Error) | ($67) |
| Iowa | $2,689 | New York | $2,437* | Wisconsin | $2,772* |
| (Standard Error) | ($49) | (Standard Error) | ($48) | (Standard Error) | ($62) |
| Kansas | $2,655 | North Carolina | $2,703 | Wyoming | $2,469* |
| (Standard Error) | ($68) | (Standard Error) | ($57) | (Standard Error) | ($60) |
| Source: Medical Expenditure Panel Survey-Insurance Component,
private-sector establishments, 2019-2021. Note: * Statistically different from the national average of $2,594 at p < 0.05. Note that the standard error on the national estimate of $2,594 is $10.84. |
|||||
|---|---|---|---|---|---|
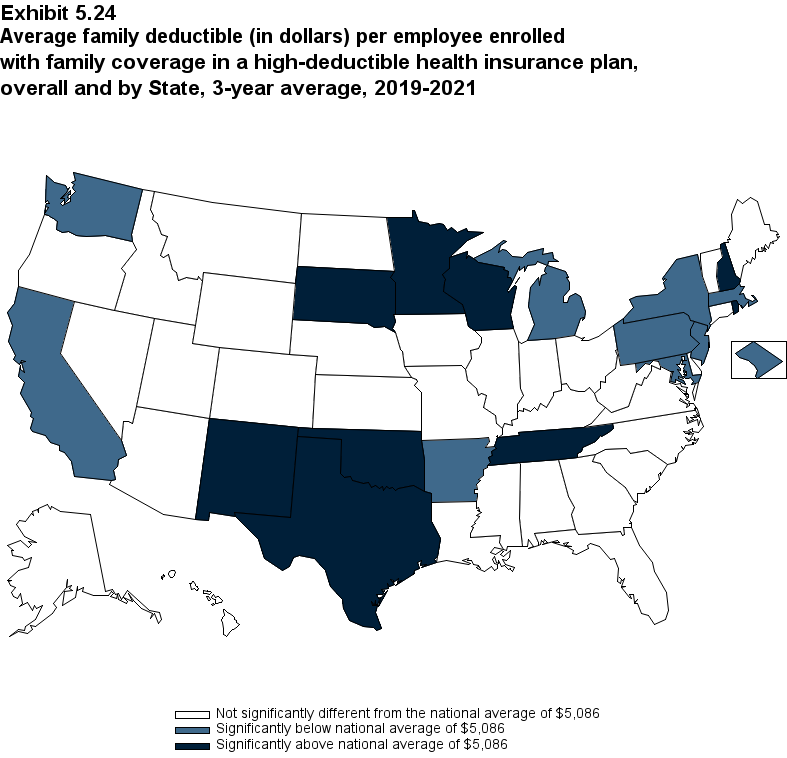
Exhibit 5.24 Average family deductible (in dollars) per employee enrolled with family coverage in a high-deductible health insurance plan, overall and by State, 3-year average, 2019-2021
| Alabama | $5,124 | Kentucky | $4,887 | North Dakota | $5,202 |
| (Standard Error) | ($164) | (Standard Error) | ($170) | (Standard Error) | ($118) |
| Alaska | $5,261 | Louisiana | $5,254 | Ohio | $5,168 |
| (Standard Error) | ($181) | (Standard Error) | ($146) | (Standard Error) | ($124) |
| Arizona | $5,552 | Maine | $5,320 | Oklahoma | $5,553* |
| (Standard Error) | ($366) | (Standard Error) | ($129) | (Standard Error) | ($184) |
| Arkansas | $4,849* | Maryland | $4,641* | Oregon | $5,095 |
| (Standard Error) | ($112) | (Standard Error) | ($127) | (Standard Error) | ($166) |
| California | $4,784* | Massachusetts | $4,684* | Pennsylvania | $4,745* |
| (Standard Error) | ($135) | (Standard Error) | ($120) | (Standard Error) | ($106) |
| Colorado | $5,269 | Michigan | $4,339* | Rhode Island | $5,536* |
| (Standard Error) | ($134) | (Standard Error) | ($123) | (Standard Error) | ($198) |
| Connecticut | $5,170 | Minnesota | $5,460* | South Carolina | $5,284 |
| (Standard Error) | ($199) | (Standard Error) | ($131) | (Standard Error) | ($157) |
| Delaware | $5,273 | Mississippi | $5,291 | South Dakota | $5,374* |
| (Standard Error) | ($167) | (Standard Error) | ($181) | (Standard Error) | ($94) |
| District of Columbia | $4,766* | Missouri | $5,273 | Tennessee | $5,585* |
| (Standard Error) | ($154) | (Standard Error) | ($147) | (Standard Error) | ($197) |
| Florida | $5,140 | Montana | $5,250 | Texas | $5,513* |
| (Standard Error) | ($221) | (Standard Error) | ($176) | (Standard Error) | ($102) |
| Georgia | $5,313 | Nebraska | $5,166 | Utah | $4,908 |
| (Standard Error) | ($218) | (Standard Error) | ($116) | (Standard Error) | ($126) |
| Hawaii | $4,909 | Nevada | $5,085 | Vermont | $5,260 |
| (Standard Error) | ($179) | (Standard Error) | ($173) | (Standard Error) | ($162) |
| Idaho | $5,080 | New Hampshire | $5,759* | Virginia | $5,269 |
| (Standard Error) | ($126) | (Standard Error) | ($158) | (Standard Error) | ($138) |
| Illinois | $5,179 | New Jersey | $4,517* | Washington | $4,640* |
| (Standard Error) | ($114) | (Standard Error) | ($123) | (Standard Error) | ($175) |
| Indiana | $5,289 | New Mexico | $5,471* | West Virginia | $5,363 |
| (Standard Error) | ($151) | (Standard Error) | ($138) | (Standard Error) | ($154) |
| Iowa | $5,274 | New York | $4,603* | Wisconsin | $5,550* |
| (Standard Error) | ($105) | (Standard Error) | ($84) | (Standard Error) | ($150) |
| Kansas | $5,146 | North Carolina | $5,085 | Wyoming | $5,173 |
| (Standard Error) | ($134) | (Standard Error) | ($144) | (Standard Error) | ($154) |
| Source: Medical Expenditure Panel Survey-Insurance Component,
private-sector establishments, 2019-2021. Note: * Statistically different from the national average of $5,086 at p < 0.05. Note that the standard error on the national estimate of $5,086 is $29.66. |
|||||
|---|---|---|---|---|---|