STATISTICAL BRIEF #524:
Trends in Health Insurance at Private Employers, 2008–2018
Highlights
- There was no statistically significant change in the overall percentage of private-sector employees covered by a health insurance plan offered by their employers between 2017 and 2018 (47.8 percent).
- Between 2017 and 2018, there was no statistically significant change in the percentage of employees working at establishments that offered insurance overall (84.6 percent in 2018) or in small (47.3 percent), medium-sized (88.0 percent), or large firms (99.0 percent).
- The eligibility rate for employees at all private-sector establishments that offered insurance increased from 76.8 percent in 2017 to 78.0 percent in 2018. In large firms, it increased from 76.6 percent to 78.0 percent. The overall and large firm eligibility rates in 2018 were higher than those observed from 2014 to 2017.
- The take-up rate at all firms declined from 73.5 percent to 72.4 percent between 2017 and 2018, and at large firms it declined from 74.5 percent to 73.3 percent. The overall and large firm take-up rates were lower than rates in almost all years in the 2008 to 2017 period.
- In 2018, average health insurance premiums were $6,715 for single coverage, $13,425 for employee-plus-one coverage, and $19,565 for family coverage, representing increases over 2017 levels of 5.4 percent for single coverage, 5.0 for employee-plus-one coverage, and 4.7 percent for family coverage.
- Average individual and family deductible levels did not increase significantly in 2018. This was the first year without a significant increase in deductible levels in the 2008 to 2018 period.
Introduction
Employer-sponsored insurance (ESI) is the primary source of health insurance coverage for individuals under age 65. This Statistical Brief uses data from the 2018 Medical Expenditure Panel Survey-Insurance Component (MEPS-IC) private-sector national tables to describe trends in employer coverage, premiums, and deductibles from 2008 to 2018. The MEPS-IC is an annual survey of private employers and state and local governments and is designed to be representative of all 50 states and the District of Columbia.This Statistical Brief describes trends and patterns in ESI for private-sector employees, overall and by three firm size categories: fewer than 50 employees (small firms), 50 to 99 employees (medium-sized firms), and 100 or more employees (large firms). All differences discussed in the text are at the 0.05 significance level, or better. All dollar estimates are nominal (not adjusted for inflation).
Findings
Enrollment rates and number of covered employeesFrom 2017 to 2018, there was no significant change in the percentage of private-sector employees covered by a health insurance plan offered by their employers (the “enrollment rate”), overall or by firm size (figure 1). The number of private-sector workers enrolled in a health insurance plan offered by their employers increased from 2017 to 2018 in all firms and in large firms. There were 62.1 million enrollees at private-sector employers in 2018, 9.1 million in small firms, 4.2 million in medium-sized firms, and 48.9 million in large firms (figure 2).
In 2018, the enrollment rate for all private-sector employees was 47.8 percent, but was 26.6 percent at small employers, 44.3 percent at medium-sized employers, and 56.5 percent at large employers (figure 1). Enrollment rates were lower at smaller (fewer than 100 employees) employers than at large employers throughout the 2008 to 2018 time period, mainly due to lower offer rates (figure 3).
Offer rates
There was no significant change in the overall percentage of employees working at establishments that offered insurance (“the offer rate”) between 2017 (84.5 percent) and 2018 (84.6 percent) (figure 3). Offer rates at small firms (with fewer than 50 employees), medium-sized firms (with 50 to 99 employees), and large firms (with 100 or more employees) were 47.3 percent, 88.0 percent, and 99.0 percent in 2018, respectively. These percentages were not statistically different from their 2017 values. Over the longer term, however, offer rates at small firms declined from 61.6 percent in 2008 to 47.3 percent in 2018.
Eligibility rates
The overall eligibility rate for employees at private-sector establishments that offered insurance increased from 76.8 percent in 2017 to 78.0 percent in 2018. The eligibility rate also increased at large firms from 76.6 percent to 78.0 percent. Overall and at large firms, the 2018 eligibility rates were higher than those observed from 2014 to 2017. Eligibility rates at small and medium-sized employers did not differ significantly from their 2017 levels (figure 4).
Take-up rates
The take-up rate declined from 73.5 percent in 2017 to 72.4 percent in 2018 at all private-sector employers, and declined from 74.5 percent to 73.3 percent at large firms. Overall and at large firms, the rates in 2018 were lower than in almost all years from 2008 to 2017. Take-up rates at small and medium-sized firms in 2018 did not differ significantly from their 2017 levels.
Premiums
In 2018, average health insurance premiums were $6,715 for single coverage (figure 6), $13,425 for employee-plus-one coverage (figure 7), and $19,565 for family coverage (figure 8), representing increases over 2017 levels of 5.4 percent for single coverage, 5.0 percent for employee-plus-one coverage, and 4.7 percent for family coverage (figure 9). In general, the 2017 to 2018 premium growth rates were not significantly different from the 2016 to 2017 rates, both overall (figure 9) and by firm size (data not shown). The only exception was for large firms, where the growth rate for single premiums (6.2 percent from 2017 to 2018) was higher than the growth rate from 2016 to 2017 (3.8 percent).
Employee premium contributions
From 2017 to 2018, there were no significant changes in average employee contribution levels for single and employee-plus-one coverage; however, employee premium contribution levels for family coverage increased significantly. Average employee contributions to health insurance premiums in 2018 were $1,427 for single coverage (figure 10), $3,634 for employee-plus-one coverage (figure 11), and $5,431 for family coverage (figure 12). At medium-sized employers, employee premium contribution levels increased significantly for single coverage ($1,534 in 2018, figure 10) and family coverage ($6,973 in 2018, figure 12).
Deductibles
In 2018, there was no significant change in the overall percentage of enrollees in a health insurance plan with a deductible (87.3 percent in 2018) (figure 13). From 2008 to 2018, the overall percentage of enrollees with a deductible increased from 70.7 percent to 87.3 percent.
Average deductible levels for single-coverage enrollees did not increase significantly in 2018. This was the first year without a significant increase in the 2008 to 2018 period. However, the average deductible level did rise significantly for single-coverage enrollees in small firms, increasing from $2,136 in 2017 to $2,327 in 2018 (an increase of 8.9 percent) (figure 14). The year 2018 was also the first time that average family deductibles did not rise significantly for family coverage enrollees (figure 15).
Average individual deductibles were higher in small ($2,327) and medium-sized firms ($2,369) than in large firms ($1,692) in 2018. Family deductibles were also higher in small ($4,364) and medium-sized firms ($4,755) than in large firms ($3,179) in 2018.
Data Source
This Statistical Brief summarizes data from the 2008 through 2018 MEPS-IC. The data are available on the MEPS website at https://www.meps.ahrq.gov/mepsweb/survey_comp/Insurance.jsp or have been produced using special computation runs on the confidential MEPS-IC data available at the U.S. Census Bureau.Definitions
Single coverageSingle coverage is health insurance that covers the employee only.
Employee-plus-one coverage
Employee-plus-one coverage is health insurance that covers the employee and one other family member at a lower premium level than family coverage. If premiums differed for employee-plus-spouse and employee-plus-child coverage, information for employee-plus-child coverage was collected.
Family coverage
Family coverage is health insurance that covers the employee and one or more family members (spouse and/or children as defined by the plan). For the MEPS-IC survey, family coverage is any coverage other than single and employee-plus-one. Some plans offer more than one rate for family coverage, depending on family size and composition. If more than one rate is offered, survey respondents are asked to report costs for a family of four.
Enrollment rate
The enrollment rate is the percentage of all employees enrolled in their employer's health insurance at establishments both offering and not offering health insurance.
Offer rate
The offer rate is the percentage of employees who work at establishments that offer health insurance.
Eligible employees
Eligible employees are those that are allowed to enroll in employer-sponsored coverage offered by their employer. Common eligibility criteria include a minimum number of hours worked per pay period or a minimum length of service with the employer.
Employee
An employee is a person on the actual payroll. This definition excludes temporary and contract workers but includes the owner or manager if that person works at the firm.
Establishment
An establishment is a single physical location of a business.
Health insurance plan
A health insurance plan is an insurance contract that provides hospital and/or physician coverage to an employee for an agreed-upon fee (premium) for a defined benefit period.
Take-up rate
The take-up rate is the percentage of eligible employees who enroll in health insurance coverage through their employer at establishments that offer insurance.
Deductible
A deductible is a fixed dollar amount during the benefit period—usually a year—that an insured person pays before the insurer starts to make payments for covered medical services. The MEPS-IC collects information on deductibles for single and family coverage.
About MEPS-IC
The MEPS-IC is a survey of private-sector business establishments and state and local governments that collects information on employer-sponsored health insurance, such as whether insurance is offered, enrollments, types of plans, and premiums. The survey is conducted annually by the U.S. Census Bureau under the sponsorship of the Agency for Healthcare Research and Quality (AHRQ). A total sample of approximately 42,000 private-sector establishments was selected for the 2018 survey, with 5.5 percent of the sample determined to be out of scope during the data collection process. The response rate for the private sector was 67.8 percent of the remaining in-scope sample units.Suggested Citation
Miller, G.E., Keenan, P. and Vistnes, J. Trends in Health Insurance at Private Employers, 2008–2018. Statistical Brief #524. July 2019. Agency for Healthcare Research and Quality, Rockville, MD. https://meps.ahrq.gov/mepsweb/data_files/publications/st524/stat524.shtml
AHRQ welcomes questions and comments from readers of this publication who are interested in obtaining more information about access, cost, use, financing, and quality of healthcare in the United States. We also invite you to tell us how you are using this Statistical Brief and other MEPS data and tools and to share suggestions on how MEPS products might be enhanced to further meet your needs. Please email us at MEPSProjectDirector@ahrq.hhs.gov or send a letter to the address below:
Joel W. Cohen, PhD, Director
Center for Financing, Access, and Cost Trends
Agency for Healthcare Research and Quality
5600 Fishers Lane, Mailstop 07W41A
Rockville, MD 20857
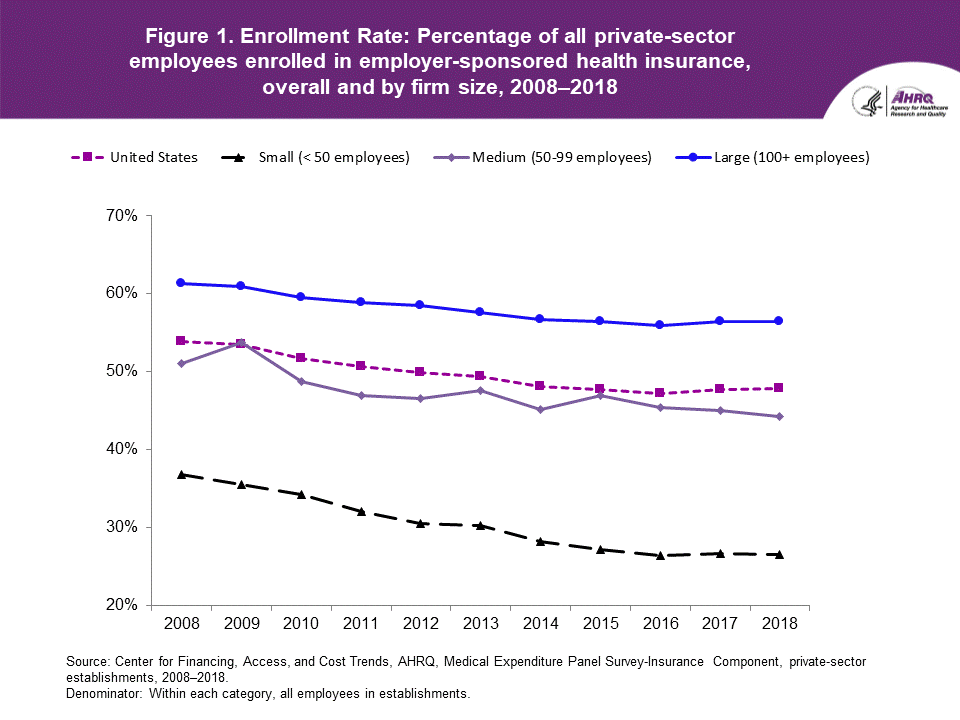
| Number of Employees | 2008 | 2009 | 2010 | 2011 | 2012 | 2013 | 2014 | 2015 | 2016 | 2017 | 2018 |
|---|---|---|---|---|---|---|---|---|---|---|---|
| United States | 53.9% | 53.5% | 51.8% | 50.6% | 49.9% | 49.4% | 48.1% | 47.8% | 47.2% | 47.7% | 47.8% |
| Small (< 50 employees) | 36.8% | 35.5% | 34.2% | 32.0% | 30.5% | 30.3% | 28.3% | 27.1% | 26.5% | 26.7% | 26.6% |
| Medium (50-99 employees) | 51.1% | 53.8% | 48.8% | 46.9% | 46.6% | 47.6% | 45.2% | 47.0% | 45.4% | 45.0% | 44.3% |
| Large (100+ employees) | 61.3% | 60.9% | 59.5% | 58.9% | 58.5% | 57.7% | 56.7% | 56.4% | 56.0% | 56.5% | 56.5% |
Source: Center for Financing, Access, and Cost Trends, AHRQ, Medical Expenditure Panel Survey-Insurance Component, private-sector establishments, 2008–2018.
Denominator: Within each category, all employees in establishments.
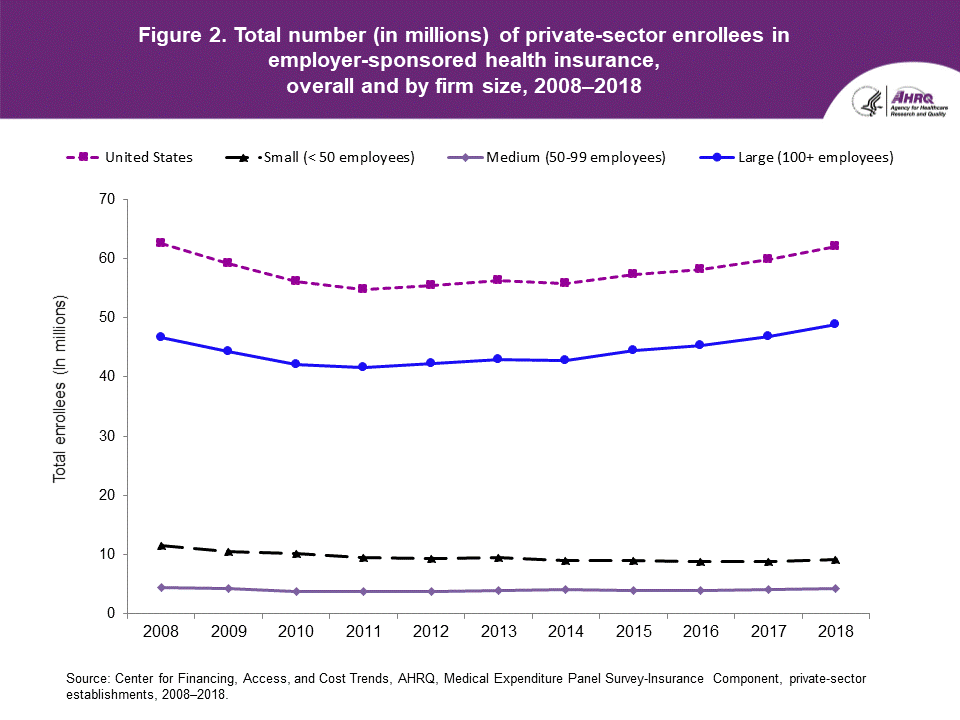
| Number of Employees | 2008 | 2009 | 2010 | 2011 | 2012 | 2013 | 2014 | 2015 | 2016 | 2017 | 2018 |
|---|---|---|---|---|---|---|---|---|---|---|---|
| United States | 62.6 | 59.2 | 56.1 | 54.8 | 55.4 | 56.3 | 55.8 | 57.3 | 58.2 | 59.9 | 62.1 |
| Small (< 50 employees) | 11.5 | 10.6 | 10.2 | 9.5 | 9.3 | 9.5 | 8.9 | 8.9 | 8.9 | 8.9 | 9.1 |
| Medium (50-99 employees) | 4.4 | 4.3 | 3.8 | 3.7 | 3.8 | 4.0 | 4.1 | 4.0 | 4.0 | 4.1 | 4.2 |
| Large (100+ employees) | 46.7 | 44.3 | 42.1 | 41.6 | 42.3 | 42.9 | 42.8 | 44.4 | 45.3 | 46.9 | 48.9 |
Source: Center for Financing, Access, and Cost Trends, AHRQ, Medical Expenditure Panel Survey-Insurance Component, private-sector establishments, 2008–2018.
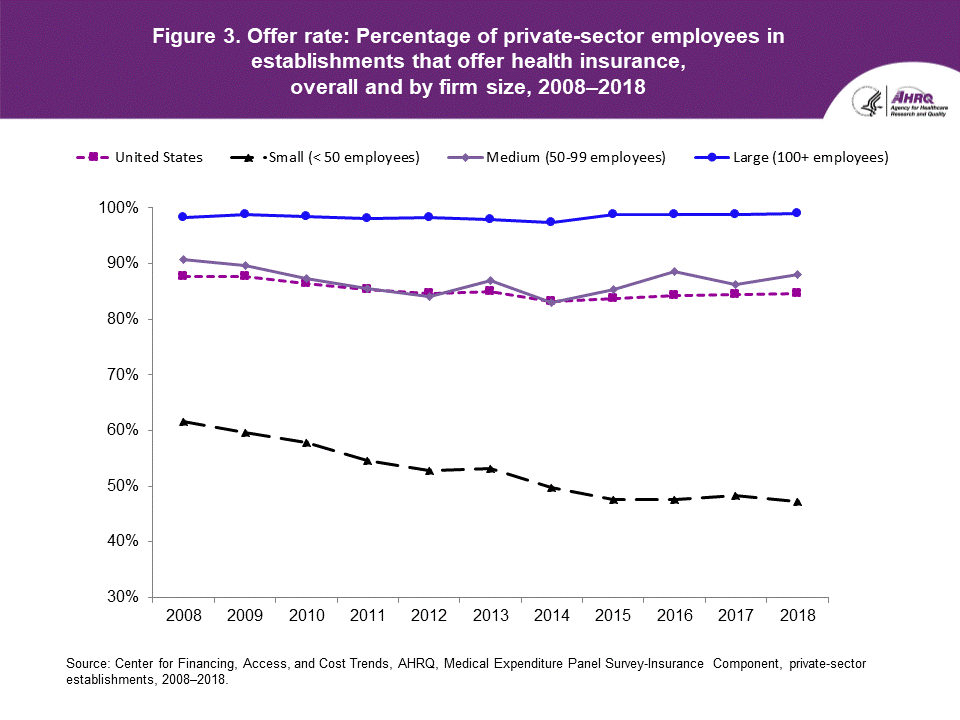
| Number of Employees | 2008 | 2009 | 2010 | 2011 | 2012 | 2013 | 2014 | 2015 | 2016 | 2017 | 2018 |
|---|---|---|---|---|---|---|---|---|---|---|---|
| United States | 87.7% | 87.6% | 86.5% | 85.3% | 84.7% | 84.9% | 83.2% | 83.8% | 84.3% | 84.5% | 84.6% |
| Small (< 50 employees) | 61.6% | 59.6% | 57.8% | 54.7% | 52.9% | 53.1% | 49.8% | 47.6% | 47.7% | 48.3% | 47.3% |
| Medium (50-99 employees) | 90.7% | 89.6% | 87.3% | 85.6% | 84.1% | 87.0% | 83.0% | 85.3% | 88.6% | 86.3% | 88.0% |
| Large (100+ employees) | 98.2% | 98.8% | 98.5% | 98.1% | 98.2% | 98.0% | 97.3% | 98.8% | 98.9% | 98.9% | 99.0% |
Source: Center for Financing, Access, and Cost Trends, AHRQ, Medical Expenditure Panel Survey-Insurance Component, private-sector establishments, 2008–2018.
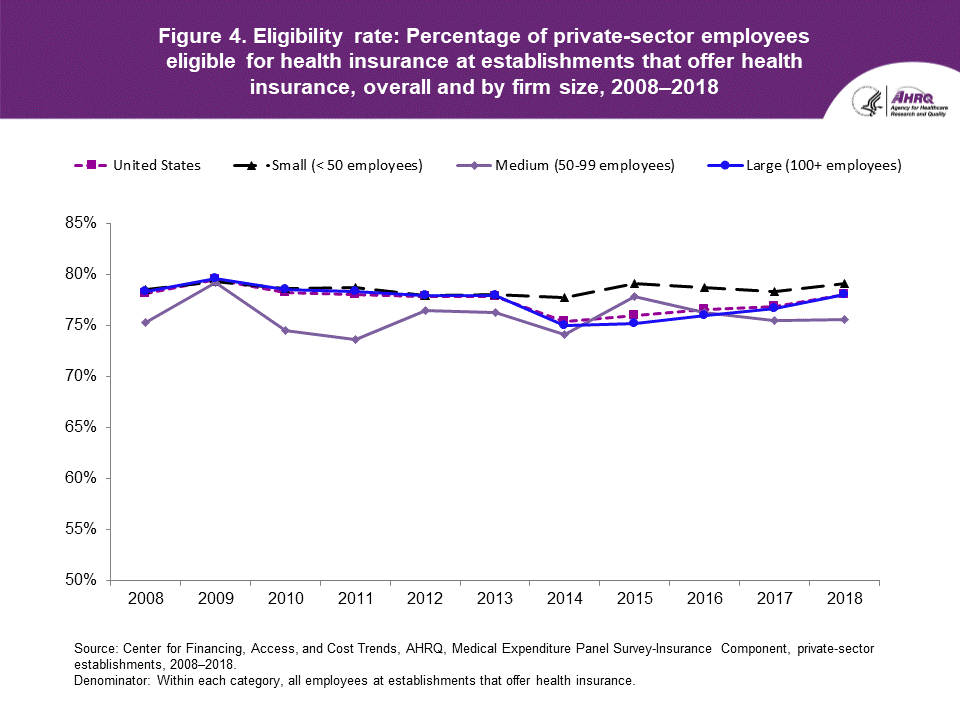
| Number of Employees | 2008 | 2009 | 2010 | 2011 | 2012 | 2013 | 2014 | 2015 | 2016 | 2017 | 2018 |
|---|---|---|---|---|---|---|---|---|---|---|---|
| United States | 78.1% | 79.5% | 78.2% | 78.0% | 77.8% | 77.8% | 75.4% | 76.0% | 76.5% | 76.8% | 78.0% |
| Small (< 50 employees) | 78.5% | 79.3% | 78.6% | 78.7% | 77.9% | 78.0% | 77.7% | 79.1% | 78.7% | 78.3% | 79.1% |
| Medium (50-99 employees) | 75.3% | 79.2% | 74.5% | 73.6% | 76.4% | 76.2% | 74.1% | 77.8% | 76.2% | 75.5% | 75.6% |
| Large (100+ employees) | 78.3% | 79.6% | 78.5% | 78.3% | 77.9% | 77.9% | 75.0% | 75.2% | 76.0% | 76.6% | 78.0% |
Source: Center for Financing, Access, and Cost Trends, AHRQ, Medical Expenditure Panel Survey-Insurance Component, private-sector establishments, 2008–2018.
Denominator: Within each category, all employees at establishments that offer health insurance.
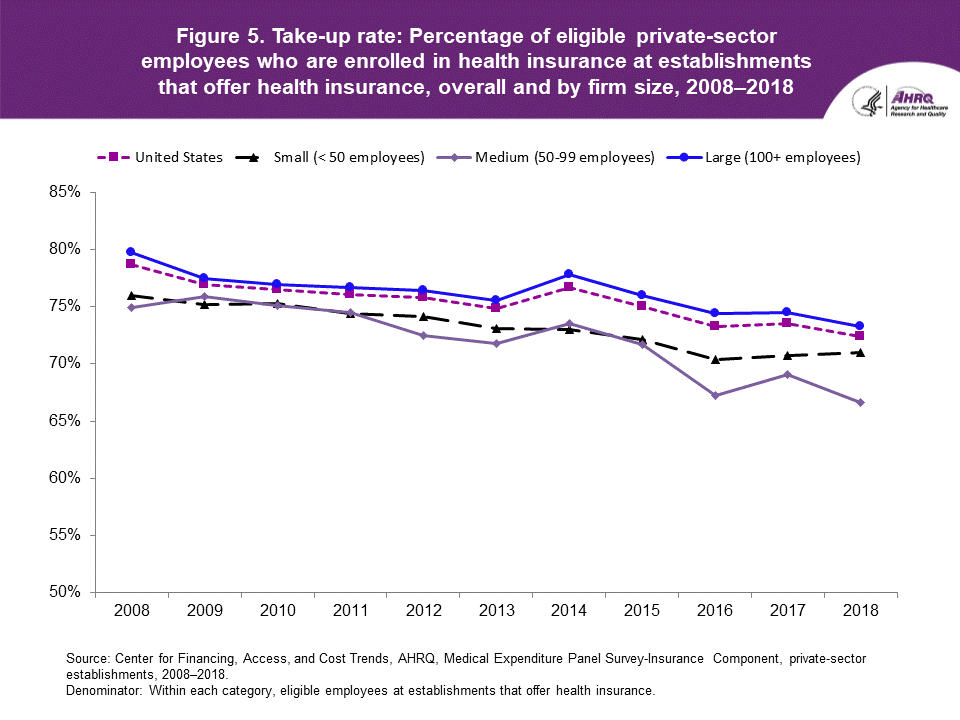
| Number of Employees | 2008 | 2009 | 2010 | 2011 | 2012 | 2013 | 2014 | 2015 | 2016 | 2017 | 2018 |
|---|---|---|---|---|---|---|---|---|---|---|---|
| United States | 78.7% | 76.9% | 76.5% | 76.1% | 75.8% | 74.8% | 76.7% | 75.0% | 73.3% | 73.5% | 72.4% |
| Small (< 50 employees) | 76.0% | 75.2% | 75.3% | 74.4% | 74.1% | 73.1% | 73.0% | 72.1% | 70.4% | 70.7% | 71.0% |
| Medium (50-99 employees) | 74.9% | 75.9% | 75.1% | 74.5% | 72.5% | 71.8% | 73.5% | 71.7% | 67.2% | 69.1% | 66.6% |
| Large (100+ employees) | 79.7% | 77.5% | 76.9% | 76.7% | 76.4% | 75.5% | 77.8% | 76.0% | 74.4% | 74.5% | 73.3% |
Source: Center for Financing, Access, and Cost Trends, AHRQ, Medical Expenditure Panel Survey-Insurance Component, private-sector establishments, 2008–2018.
Denominator: Within each category, eligible employees at establishments that offer health insurance.
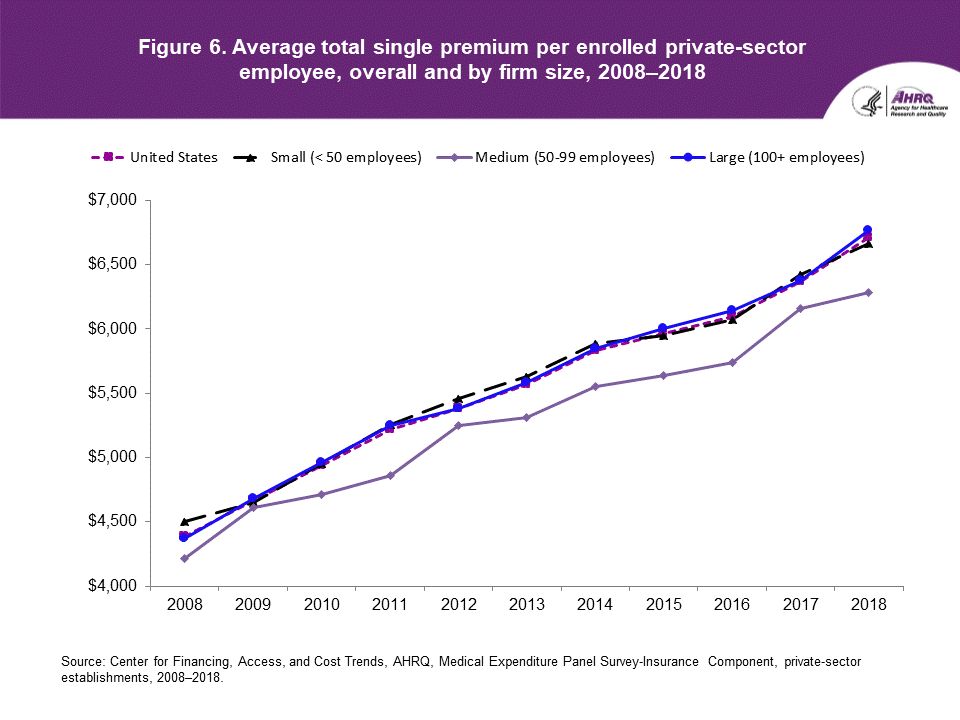
| Number of Employees | 2008 | 2009 | 2010 | 2011 | 2012 | 2013 | 2014 | 2015 | 2016 | 2017 | 2018 |
|---|---|---|---|---|---|---|---|---|---|---|---|
| United States | $4,386 | $4,669 | $4,940 | $5,222 | $5,384 | $5,571 | $5,832 | $5,963 | $6,101 | $6,368 | $6,715 |
| Small (< 50 employees) | $4,501 | $4,652 | $4,956 | $5,258 | $5,460 | $5,628 | $5,886 | $5,947 | $6,070 | $6,421 | $6,667 |
| Medium (50-99 employees) | $4,215 | $4,614 | $4,713 | $4,861 | $5,246 | $5,314 | $5,549 | $5,642 | $5,743 | $6,163 | $6,287 |
| Large (100+ employees) | $4,370 | $4,681 | $4,959 | $5,252 | $5,378 | $5,584 | $5,851 | $6,006 | $6,146 | $6,377 | $6,770 |
Source: Center for Financing, Access, and Cost Trends, AHRQ, Medical Expenditure Panel Survey-Insurance Component, private-sector establishments, 2008–2018.
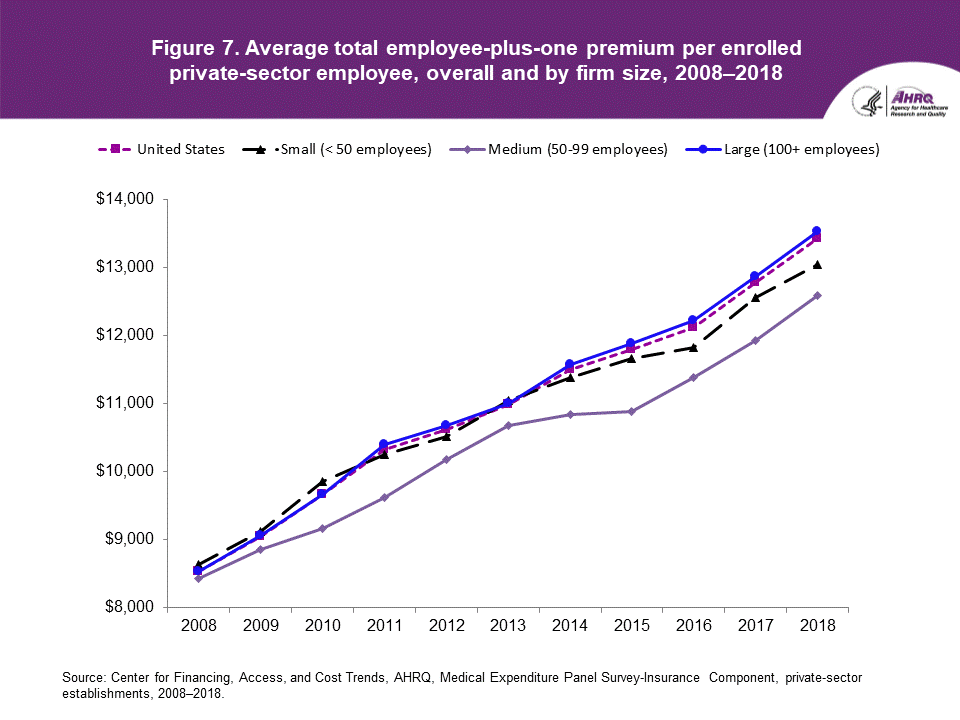
| Number of Employees | 2008 | 2009 | 2010 | 2011 | 2012 | 2013 | 2014 | 2015 | 2016 | 2017 | 2018 |
|---|---|---|---|---|---|---|---|---|---|---|---|
| United States | $8,535 | $9,053 | $9,664 | $10,329 | $10,621 | $10,990 | $11,503 | $11,800 | $12,124 | $12,789 | $13,425 |
| Small (< 50 employees) | $8,631 | $9,124 | $9,850 | $10,253 | $10,524 | $11,050 | $11,386 | $11,666 | $11,833 | $12,558 | $13,044 |
| Medium (50-99 employees) | $8,421 | $8,852 | $9,166 | $9,615 | $10,178 | $10,673 | $10,845 | $10,885 | $11,389 | $11,931 | $12,593 |
| Large (100+ employees) | $8,527 | $9,058 | $9,669 | $10,394 | $10,672 | $11,006 | $11,571 | $11,892 | $12,225 | $12,878 | $13,537 |
Source: Center for Financing, Access, and Cost Trends, AHRQ, Medical Expenditure Panel Survey-Insurance Component, private-sector establishments, 2008–2018.
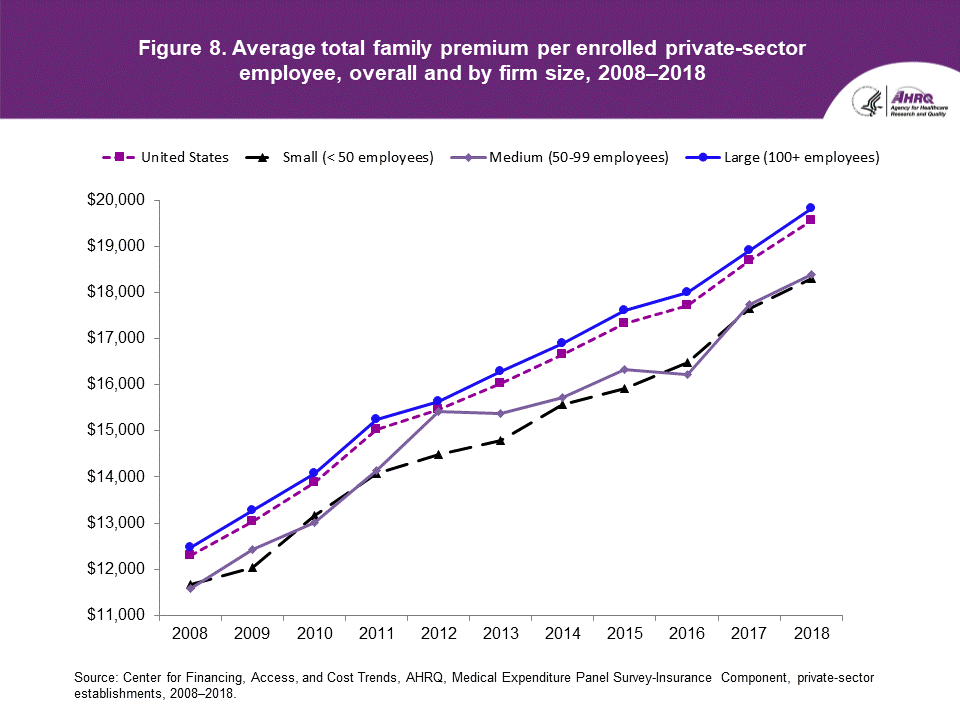
| Number of Employees | 2008 | 2009 | 2010 | 2011 | 2012 | 2013 | 2014 | 2015 | 2016 | 2017 | 2018 |
|---|---|---|---|---|---|---|---|---|---|---|---|
| United States | $12,298 | $13,027 | $13,871 | $15,022 | $15,473 | $16,029 | $16,655 | $17,322 | $17,710 | $18,687 | $19,565 |
| Small (< 50 employees) | $11,679 | $12,041 | $13,170 | $14,086 | $14,496 | $14,787 | $15,575 | $15,919 | $16,471 | $17,649 | $18,296 |
| Medium (50-99 employees) | $11,578 | $12,431 | $13,019 | $14,151 | $15,421 | $15,376 | $15,732 | $16,336 | $16,214 | $17,735 | $18,386 |
| Large (100+ employees) | $12,468 | $13,271 | $14,074 | $15,245 | $15,641 | $16,284 | $16,903 | $17,612 | $18,000 | $18,911 | $19,824 |
Source: Center for Financing, Access, and Cost Trends, AHRQ, Medical Expenditure Panel Survey-Insurance Component, private-sector establishments, 2008–2018.
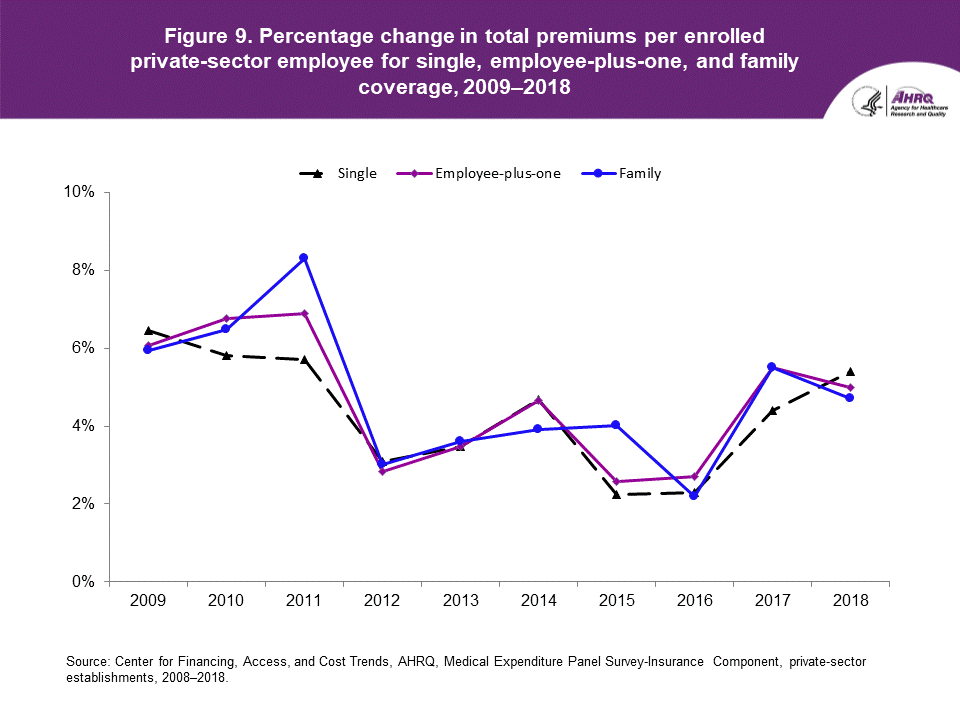
| Coverage | 2009 | 2010 | 2011 | 2012 | 2013 | 2014 | 2015 | 2016 | 2017 | 2018 |
|---|---|---|---|---|---|---|---|---|---|---|
| Single | 6.5% | 5.8% | 5.7% | 3.1% | 3.5% | 4.7% | 2.2% | 2.3% | 4.4% | 5.4% |
| Employee-plus-one | 6.1% | 6.7% | 6.9% | 2.8% | 3.5% | 4.7% | 2.6% | 2.7% | 5.5% | 5.0% |
| Family | 5.9% | 6.5% | 8.3% | 3.0% | 3.6% | 3.9% | 4.0% | 2.2% | 5.5% | 4.7% |
Source: Center for Financing, Access, and Cost Trends, AHRQ, Medical Expenditure Panel Survey-Insurance Component, private-sector establishments, 2008–2018.
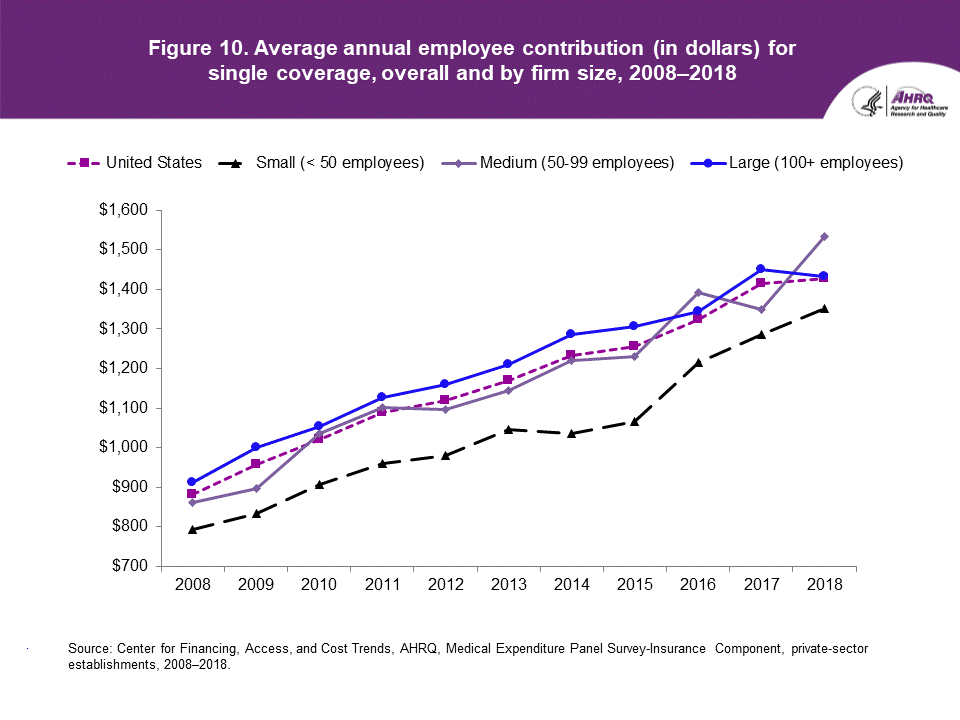
| Number of Employees | 2008 | 2009 | 2010 | 2011 | 2012 | 2013 | 2014 | 2015 | 2016 | 2017 | 2018 |
|---|---|---|---|---|---|---|---|---|---|---|---|
| United States | $882 | $957 | $1,021 | $1,090 | $1,118 | $1,170 | $1,234 | $1,255 | $1,325 | $1,415 | $1,427 |
| Small (< 50 employees) | $794 | $834 | $907 | $960 | $979 | $1,045 | $1,035 | $1,065 | $1,216 | $1,287 | $1,351 |
| Medium (50-99 employees) | $861 | $896 | $1,035 | $1,101 | $1,096 | $1,145 | $1,220 | $1,230 | $1,393 | $1,349 | $1,534 |
| Large (100+ employees) | $912 | $1,000 | $1,054 | $1,127 | $1,159 | $1,209 | $1,287 | $1,307 | $1,343 | $1,451 | $1,433 |
Source: Center for Financing, Access, and Cost Trends, AHRQ, Medical Expenditure Panel Survey-Insurance Component, private-sector establishments, 2008–2018.
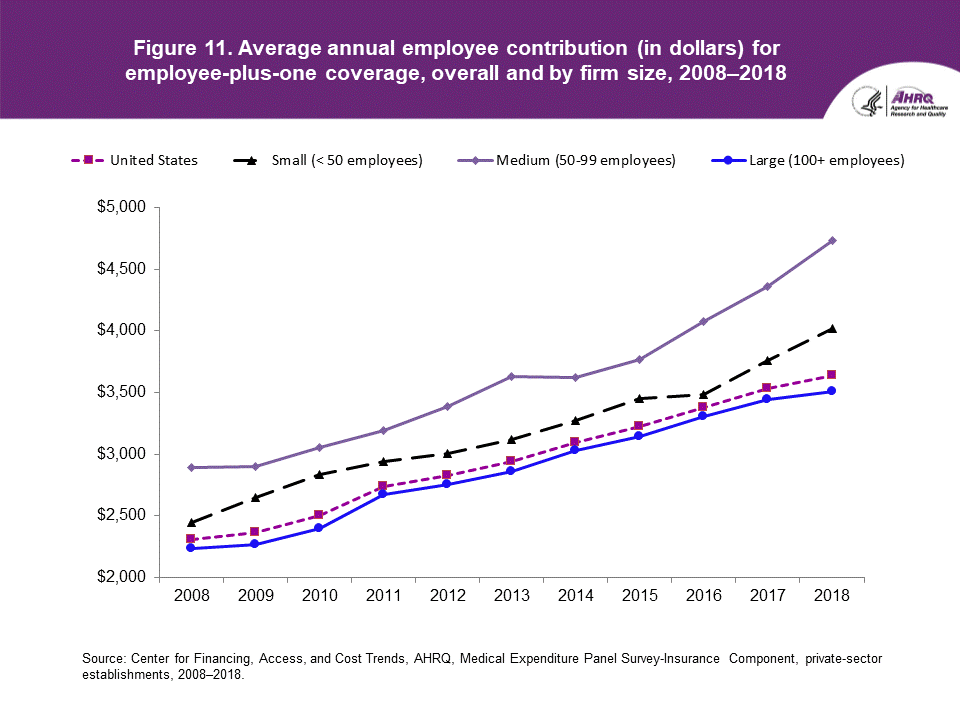
| Number of Employees | 2008 | 2009 | 2010 | 2011 | 2012 | 2013 | 2014 | 2015 | 2016 | 2017 | 2018 |
|---|---|---|---|---|---|---|---|---|---|---|---|
| United States | $2,303 | $2,363 | $2,498 | $2,736 | $2,824 | $2,940 | $3,097 | $3,220 | $3,376 | $3,531 | $3,634 |
| Small (< 50 employees) | $2,442 | $2,648 | $2,836 | $2,942 | $3,004 | $3,117 | $3,275 | $3,454 | $3,479 | $3,760 | $4,017 |
| Medium (50-99 employees) | $2,894 | $2,901 | $3,056 | $3,189 | $3,389 | $3,630 | $3,619 | $3,765 | $4,077 | $4,358 | $4,732 |
| Large (100+ employees) | $2,235 | $2,270 | $2,398 | $2,670 | $2,751 | $2,862 | $3,031 | $3,144 | $3,307 | $3,445 | $3,504 |
Source: Center for Financing, Access, and Cost Trends, AHRQ, Medical Expenditure Panel Survey-Insurance Component, private-sector establishments, 2008–2018.
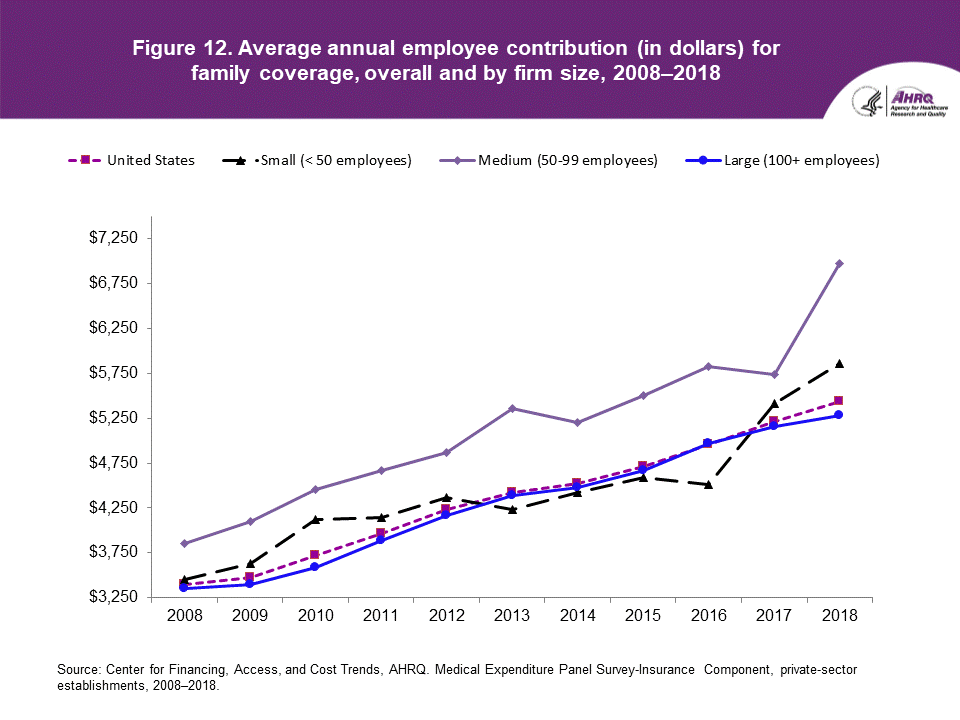
| Number of Employees | 2008 | 2009 | 2010 | 2011 | 2012 | 2013 | 2014 | 2015 | 2016 | 2017 | 2018 |
|---|---|---|---|---|---|---|---|---|---|---|---|
| United States | $3,394 | $3,474 | $3,721 | $3,962 | $4,236 | $4,421 | $4,518 | $4,710 | $4,956 | $5,218 | $5,431 |
| Small (< 50 employees) | $3,458 | $3,630 | $4,117 | $4,144 | $4,366 | $4,228 | $4,426 | $4,587 | $4,510 | $5,413 | $5,854 |
| Medium (50-99 employees) | $3,852 | $4,102 | $4,455 | $4,669 | $4,866 | $5,360 | $5,206 | $5,502 | $5,821 | $5,738 | $6,973 |
| Large (100+ employees) | $3,348 | $3,393 | $3,588 | $3,882 | $4,169 | $4,387 | $4,483 | $4,671 | $4,971 | $5,154 | $5,277 |
Source: Center for Financing, Access, and Cost Trends, AHRQ, Medical Expenditure Panel Survey-Insurance Component, private-sector establishments, 2008–2018.
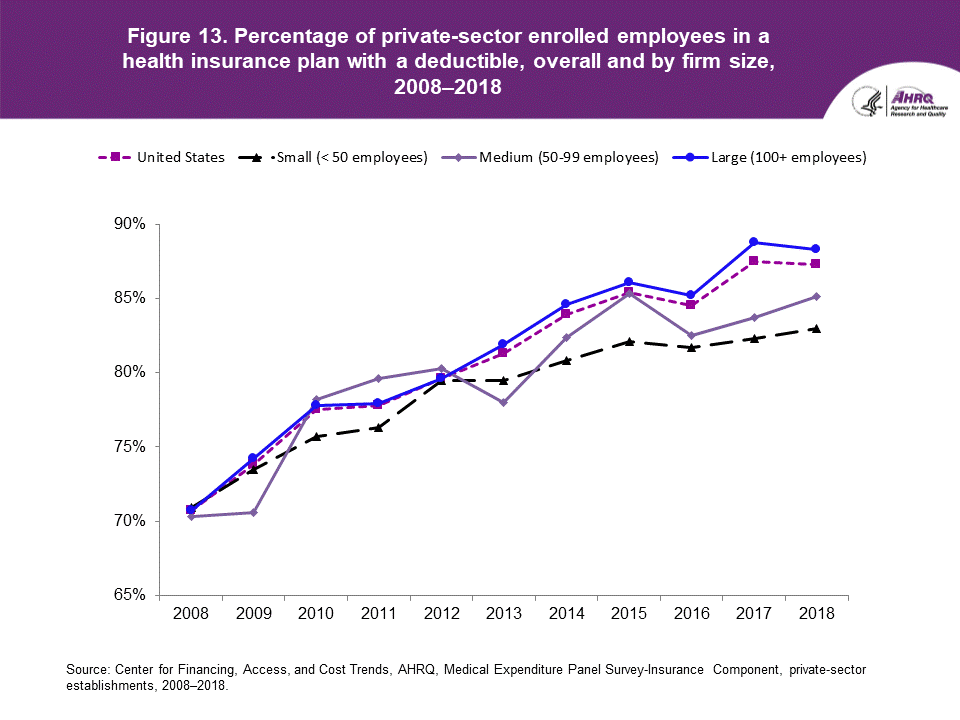
| Number of Employees | 2008 | 2009 | 2010 | 2011 | 2012 | 2013 | 2014 | 2015 | 2016 | 2017 | 2018 |
|---|---|---|---|---|---|---|---|---|---|---|---|
| United States | 70.7% | 73.8% | 77.5% | 77.8% | 79.6% | 81.3% | 83.9% | 85.4% | 84.5% | 87.5% | 87.3% |
| Small (< 50 employees) | 70.9% | 73.5% | 75.7% | 76.3% | 79.5% | 79.5% | 80.8% | 82.1% | 81.7% | 82.3% | 83.0% |
| Medium (50-99 employees) | 70.3% | 70.6% | 78.2% | 79.6% | 80.3% | 78.0% | 82.4% | 85.3% | 82.5% | 83.7% | 85.1% |
| Large (100+ employees) | 70.7% | 74.2% | 77.8% | 77.9% | 79.6% | 81.9% | 84.6% | 86.1% | 85.2% | 88.8% | 88.3% |
Source: Center for Financing, Access, and Cost Trends, AHRQ, Medical Expenditure Panel Survey-Insurance Component, private-sector establishments, 2008–2018.
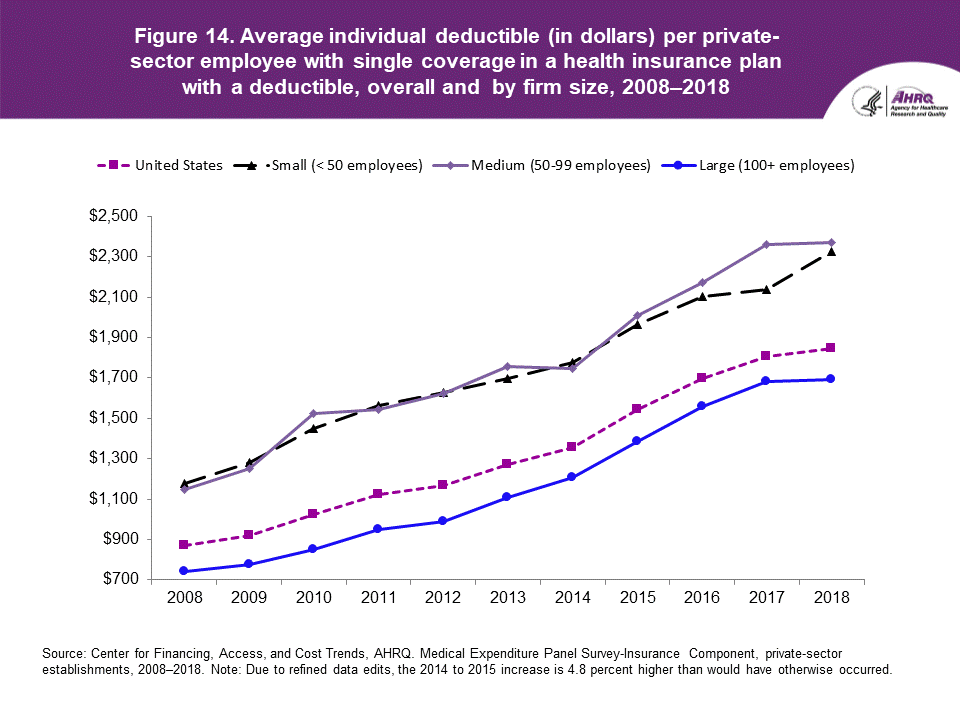
| Number of Employees | 2008 | 2009 | 2010 | 2011 | 2012 | 2013 | 2014 | 2015 | 2016 | 2017 | 2018 |
|---|---|---|---|---|---|---|---|---|---|---|---|
| United States | $869 | $917 | $1,025 | $1,123 | $1,167 | $1,273 | $1,353 | $1,541 | $1,696 | $1,808 | $1,846 |
| Small (< 50 employees) | $1,177 | $1,283 | $1,447 | $1,561 | $1,628 | $1,695 | $1,777 | $1,964 | $2,105 | $2,136 | $2,327 |
| Medium (50-99 employees) | $1,149 | $1,249 | $1,522 | $1,543 | $1,622 | $1,755 | $1,744 | $2,008 | $2,173 | $2,361 | $2,369 |
| Large (100+ employees) | $740 | $774 | $852 | $951 | $989 | $1,106 | $1,205 | $1,383 | $1,558 | $1,681 | $1,692 |
Source: Center for Financing, Access, and Cost Trends, AHRQ, Medical Expenditure Panel Survey-Insurance Component, private-sector establishments, 2008–2018.
Note: Due to refined data edits, the 2014 to 2015 increase is 4.8 percent higher than would have otherwise occurred.
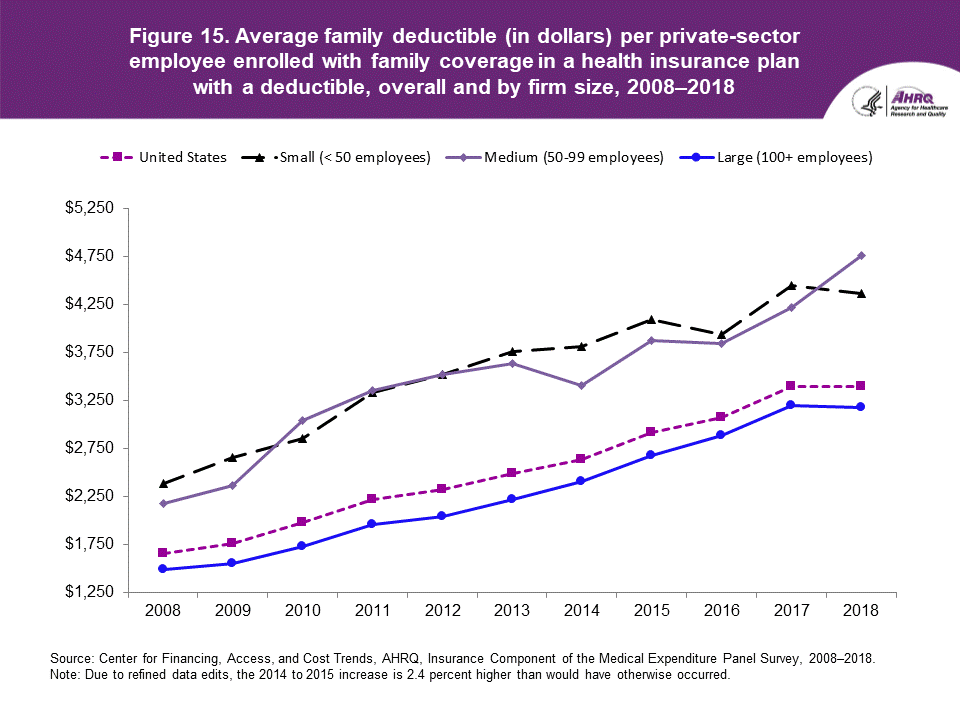
| Number of Employees | 2008 | 2009 | 2010 | 2011 | 2012 | 2013 | 2014 | 2015 | 2016 | 2017 | 2018 |
|---|---|---|---|---|---|---|---|---|---|---|---|
| United States | $1,658 | $1,761 | $1,975 | $2,220 | $2,322 | $2,491 | $2,640 | $2,915 | $3,069 | $3,396 | $3,392 |
| Small (< 50 employees) | $2,389 | $2,652 | $2,857 | $3,329 | $3,515 | $3,761 | $3,810 | $4,090 | $3,940 | $4,447 | $4,364 |
| Medium (50-99 employees) | $2,173 | $2,362 | $3,040 | $3,349 | $3,523 | $3,634 | $3,404 | $3,875 | $3,840 | $4,218 | $4,755 |
| Large (100+ employees) | $1,488 | $1,552 | $1,734 | $1,954 | $2,038 | $2,215 | $2,408 | $2,676 | $2,887 | $3,195 | $3,179 |
Source: Center for Financing, Access, and Cost Trends, AHRQ, Medical Expenditure Panel Survey-Insurance Component, private-sector establishments, 2008–2018.
Note: Due to refined data edits, the 2014 to 2015 increase is 2.4 percent higher than would have otherwise occurred.